Zegras at center: what his faceoffs would actually cost
He won 36% of his draws, worst on the team and below the worst regular taker in the league. Priced at what a won faceoff is worth, a full season of him taking every draw at center costs about two goals — a third of a win — and the bench already hedges half of it.
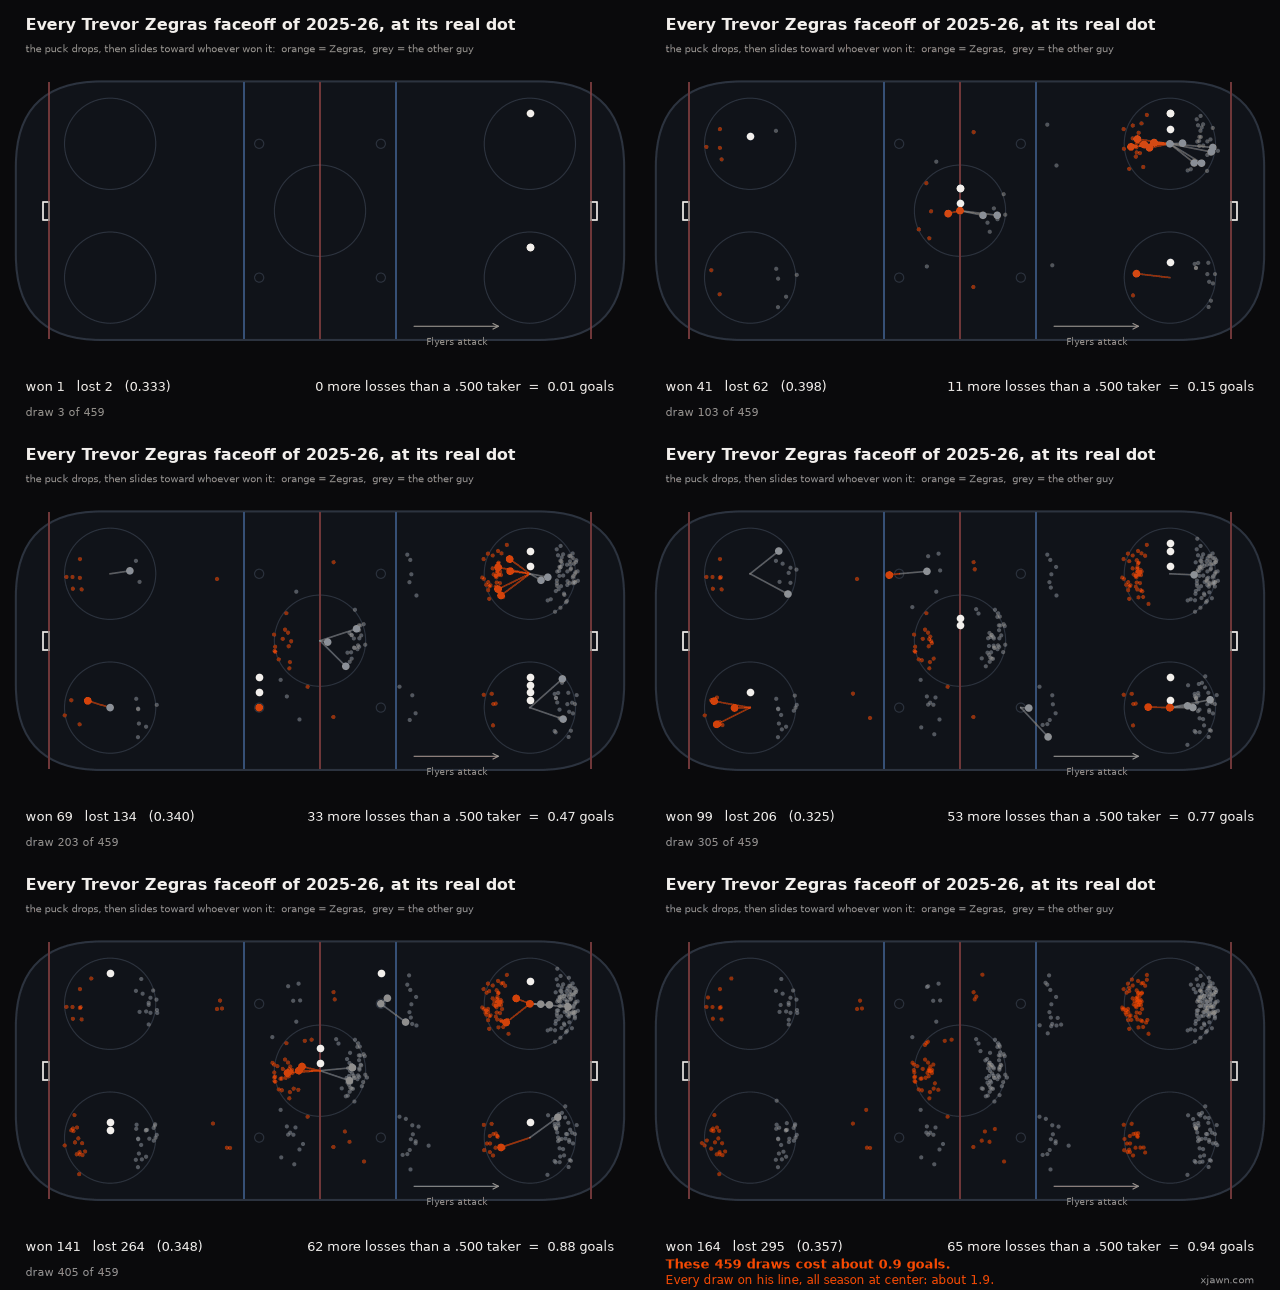
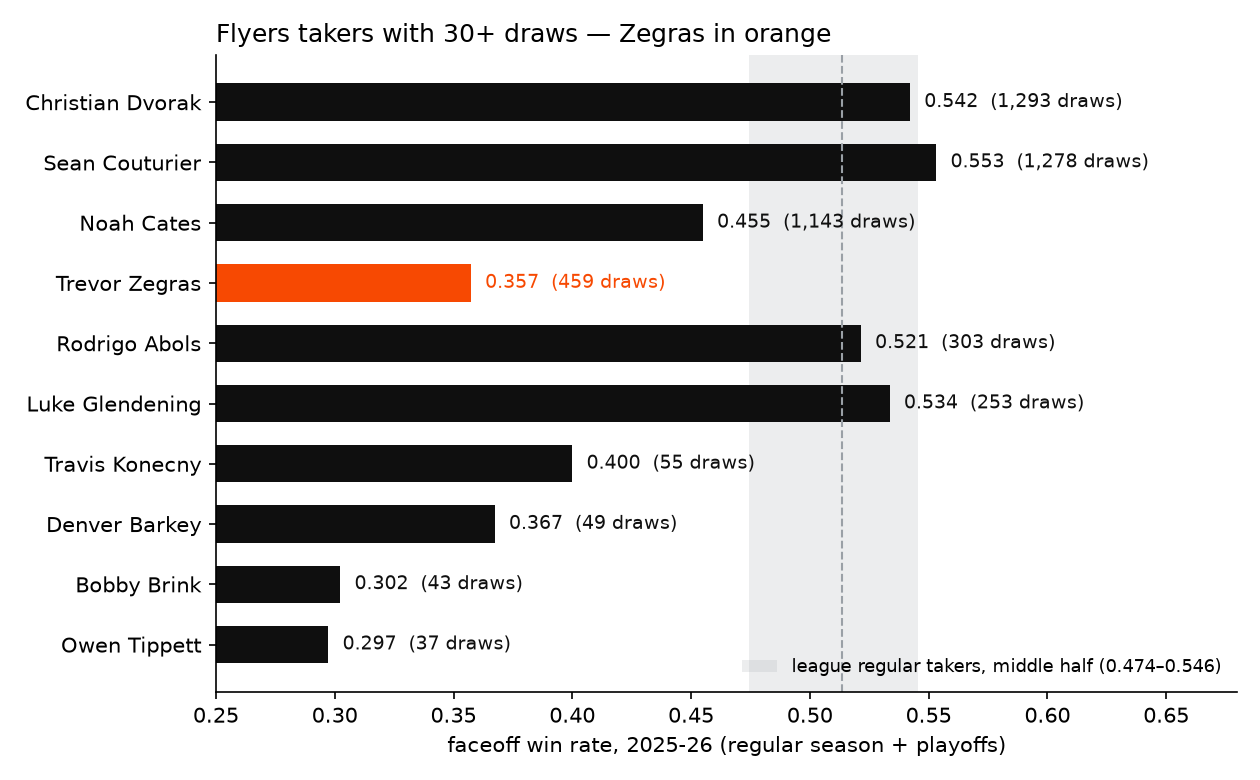
The argument for giving Trevor Zegras a longer look at center always runs into the same wall, and the wall is a real one. He won 35.7% of his 459 draws last season. That is the worst rate on the team by eight points, and it is below the worst of the 123 players in the league who took 500 or more draws (0.386). Our faceoff model, which adjusts every draw for the opponent, the dot, handedness, size and fatigue, puts him in the 10th percentile of 518 active takers. Nobody is arguing that he is good at this.
The question worth arguing about is what it costs. Not in percentage points — in goals, and then in wins.
Three numbers from the faceoff work
The general-audience version of this has the method. The short form:
- A won draw is worth 0.0144 expected goals — the winner's edge over the fifteen seconds that follow, measured within bins of the model's own win probability so that won and lost draws are compared between matched takers, not between good teams and bad ones.
- So about 70 extra wins make one goal.
- Offensive-zone and defensive-zone draws are worth the same (0.0180 and 0.0176); the neutral zone a third of that. At Zegras's own mix of dots the blended value is 0.0137 — close enough to the headline that we use the headline below.
How bad is he, read three ways
Any honest price needs a win rate to plug in, and there are three defensible ones:
| reading | win rate | what it is |
|---|---|---|
| last season | 0.357 | 459 draws, 2025-26 |
| career | 0.391 | 1,996 draws since 2020-21 |
| model projection | 0.429 | his fitted skill against an average opponent on a neutral dot |
The model is the kindest of the three, and the reason is worth a sentence. Roughly half of a bad raw rate is who you face: the other bench sends its best man out against a known weak taker, and the model pays for that opponent before it scores the residual. It also shrinks a short record toward the mean, and 1,996 draws is a short record for this purpose. His season-by-season line has been sliding (.438, .399, .414, .384, .366, .357), so "last season" is the pessimist's number and the model is the optimist's. We price all three and let you pick.
What actually happens to the draws when he is the center
Here is the part of the argument that usually goes missing. "Zegras at center" does not mean "Zegras takes every faceoff." Part 1 of our center-or-wing series established which nights he played in the middle last season — 39 games — and on those nights the play-by-play says who took each draw with him on the ice:
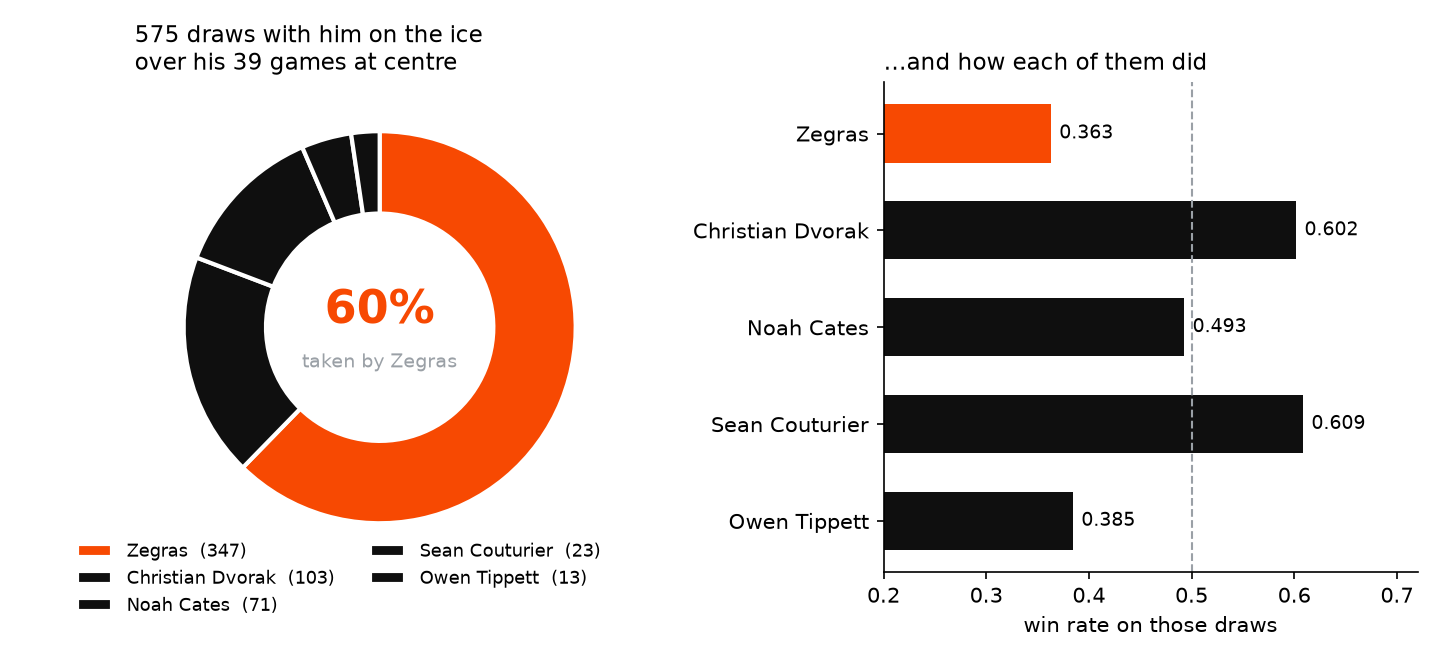
With him on the ice the Flyers took 14.7 draws a game. He took 60% of them and won 0.363. The other 40% went mostly to Dvorak and Cates when they happened to be out there, and to Couturier when the situation warranted fetching him — and that group won 0.526. The coaches were doing, by hand and on the fly, exactly what the arithmetic says to do.
That is not a Flyers invention. The league-wide read found that coaches treat the choice of taker as a faceoff-only decision, and that handing the draw to a better taker who is already on the ice costs nothing on the line side — the swap lasts one draw and everyone stays out. The price of Zegras at center is therefore bounded by a choice the bench makes sixty times a night, not by his percentage.
The price
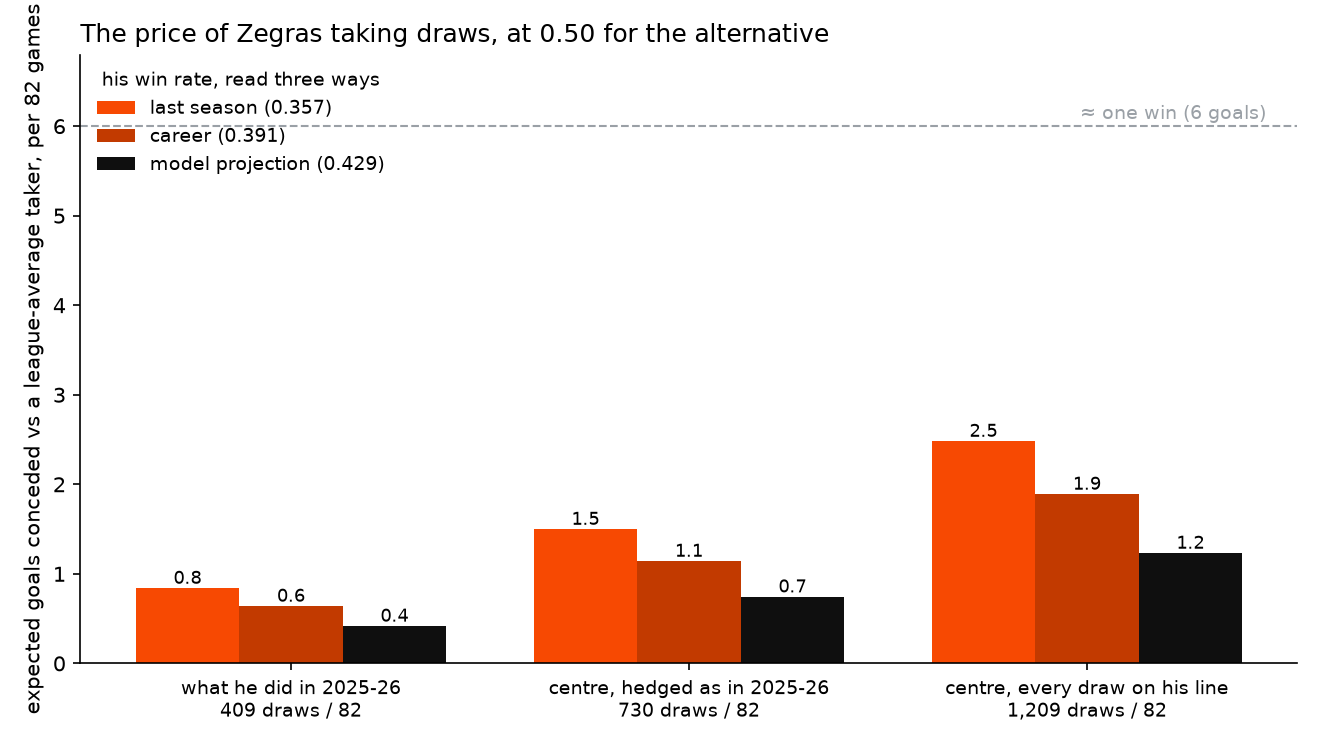
Multiply it out. Per 82 games, against a league-average taker:
| workload | draws / 82 | last season | career | model |
|---|---|---|---|---|
| what he did in 2025-26 | 409 | 0.8 | 0.6 | 0.4 |
| center, hedged as the Flyers did it | 730 | 1.5 | 1.1 | 0.7 |
| center, every draw on his line | 1,209 | 2.5 | 1.9 | 1.2 |
Expected goals conceded over a season, relative to a .500 taker at the same dots. "Every draw on his line" is 14.7 a game — the rate with him on the ice last season — scaled to 82 games.
The worst case on the board — he plays center all year, takes every single draw his line gets, and wins at last season's rate — costs 2.5 goals over a season against an average taker. The alternative that people actually have in mind is not an average taker but Dvorak or Couturier, who won 0.548 between them; against that bar the same worst case is 3.3 goals. Run it at his career rate and it is 1.9; at the model's projection, 1.2. Run it the way the Flyers ran it last spring — center, with the bench taking four draws in ten — and the whole range is 0.7 to 1.5 goals.
At the usual rule of thumb of about 6 goals per standings win, the honest headline is that a full season of Zegras's faceoffs at center costs the Flyers somewhere between a fifth and a half of a win, with the middle of the range around a third. It is not nothing. It is also a number the bench can cut in half without changing the lineup.
Which draws are the expensive ones
Added 2026-08-23. On r/Flyers, u/HnMike, u/PhillyGarbage93 and u/DelcoInDaHouse each made a version of the same point: not every faceoff costs the same, and the ones that hurt are the power-play draws, the draw after an icing, the one that opens a power play. Fair. Here is the same 15-second method, split by situation. The numbers above already use these differences; this is what they look like on their own.
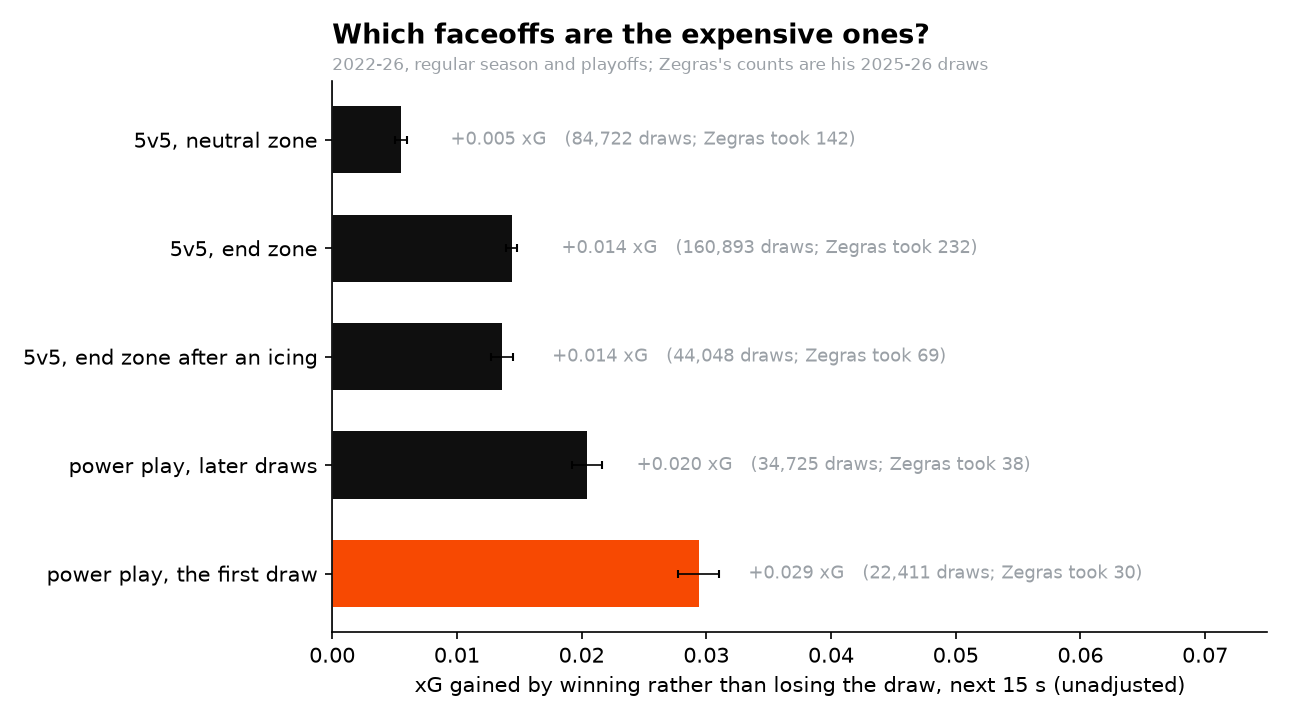
Two things stand out. The first draw of a power play is the most expensive faceoff in the game: 0.029 xG to the team with the man advantage, about 2.0 times an ordinary end-zone draw and well above the later power-play draws (0.020). That is the one u/HnMike had in mind, and the instinct is right. Zegras took 30 of them last season. At his rate against an average taker that is about 0.13 goals, real and small, because there are not many of them. If there is one kind of draw to take away from him, it is that one.
The other is what the chart seems not to show. The draw after an icing is worth the same as any other end-zone draw (0.014 against 0.014), and that reads as "icings don't matter," which is wrong. Icings matter; they just don't act through the faceoff. After an icing the tired team loses the draw 6 points more often, and the fresh team out-chances it by an extra 0.003 xG whether it wins the draw or not. The advantage lands in both arms, so the gap between a won and a lost draw, which is what the bars measure, stays put. Most of the icing edge is five gassed skaters, not the puck drop.
These are the unadjusted contrasts; on the pooled number the matching described below moved it five percent, so the ordering is the claim here, not the third decimal.
For scale
On our value ledger, Zegras was worth +10.5 goals above replacement last season — 46th of 560 skaters with 300-plus minutes. His penalty differential cost 1.0 of that on its own. Against that line, the faceoff cost in the middle of our range is a fifth of his value, and in the worst case a third — real, and worth a coach's attention, and not close to the size of the decision it keeps getting attached to.
Here is the whole profile at once — both sides of his card, exactly as his player page draws them:
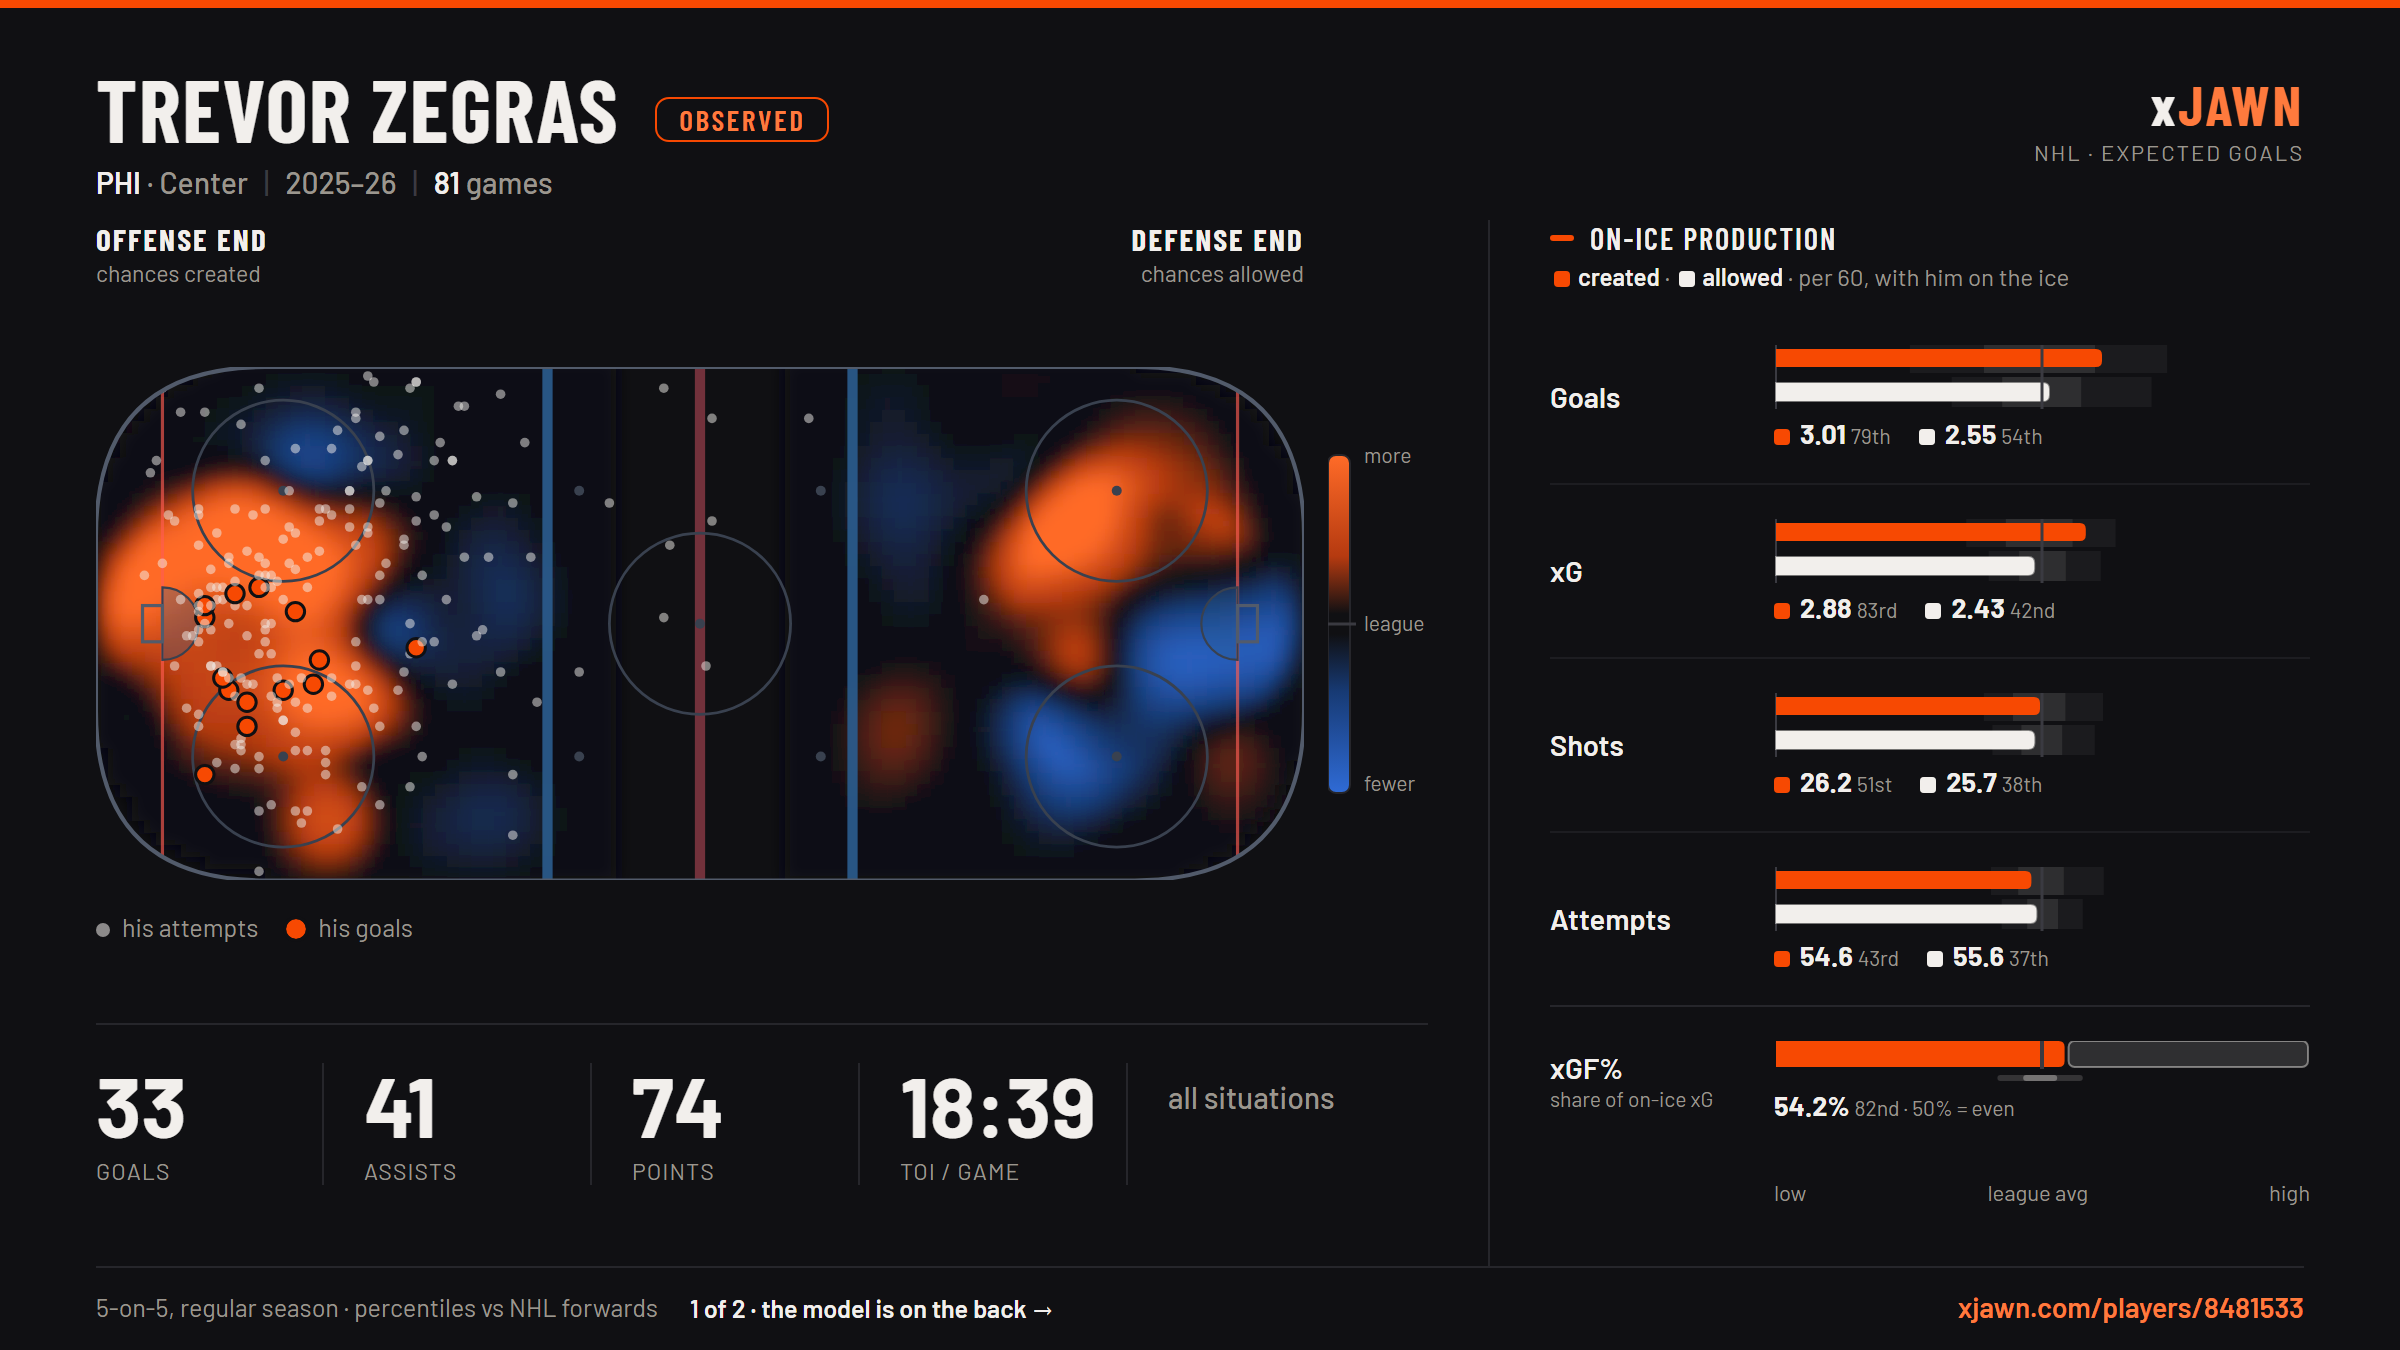
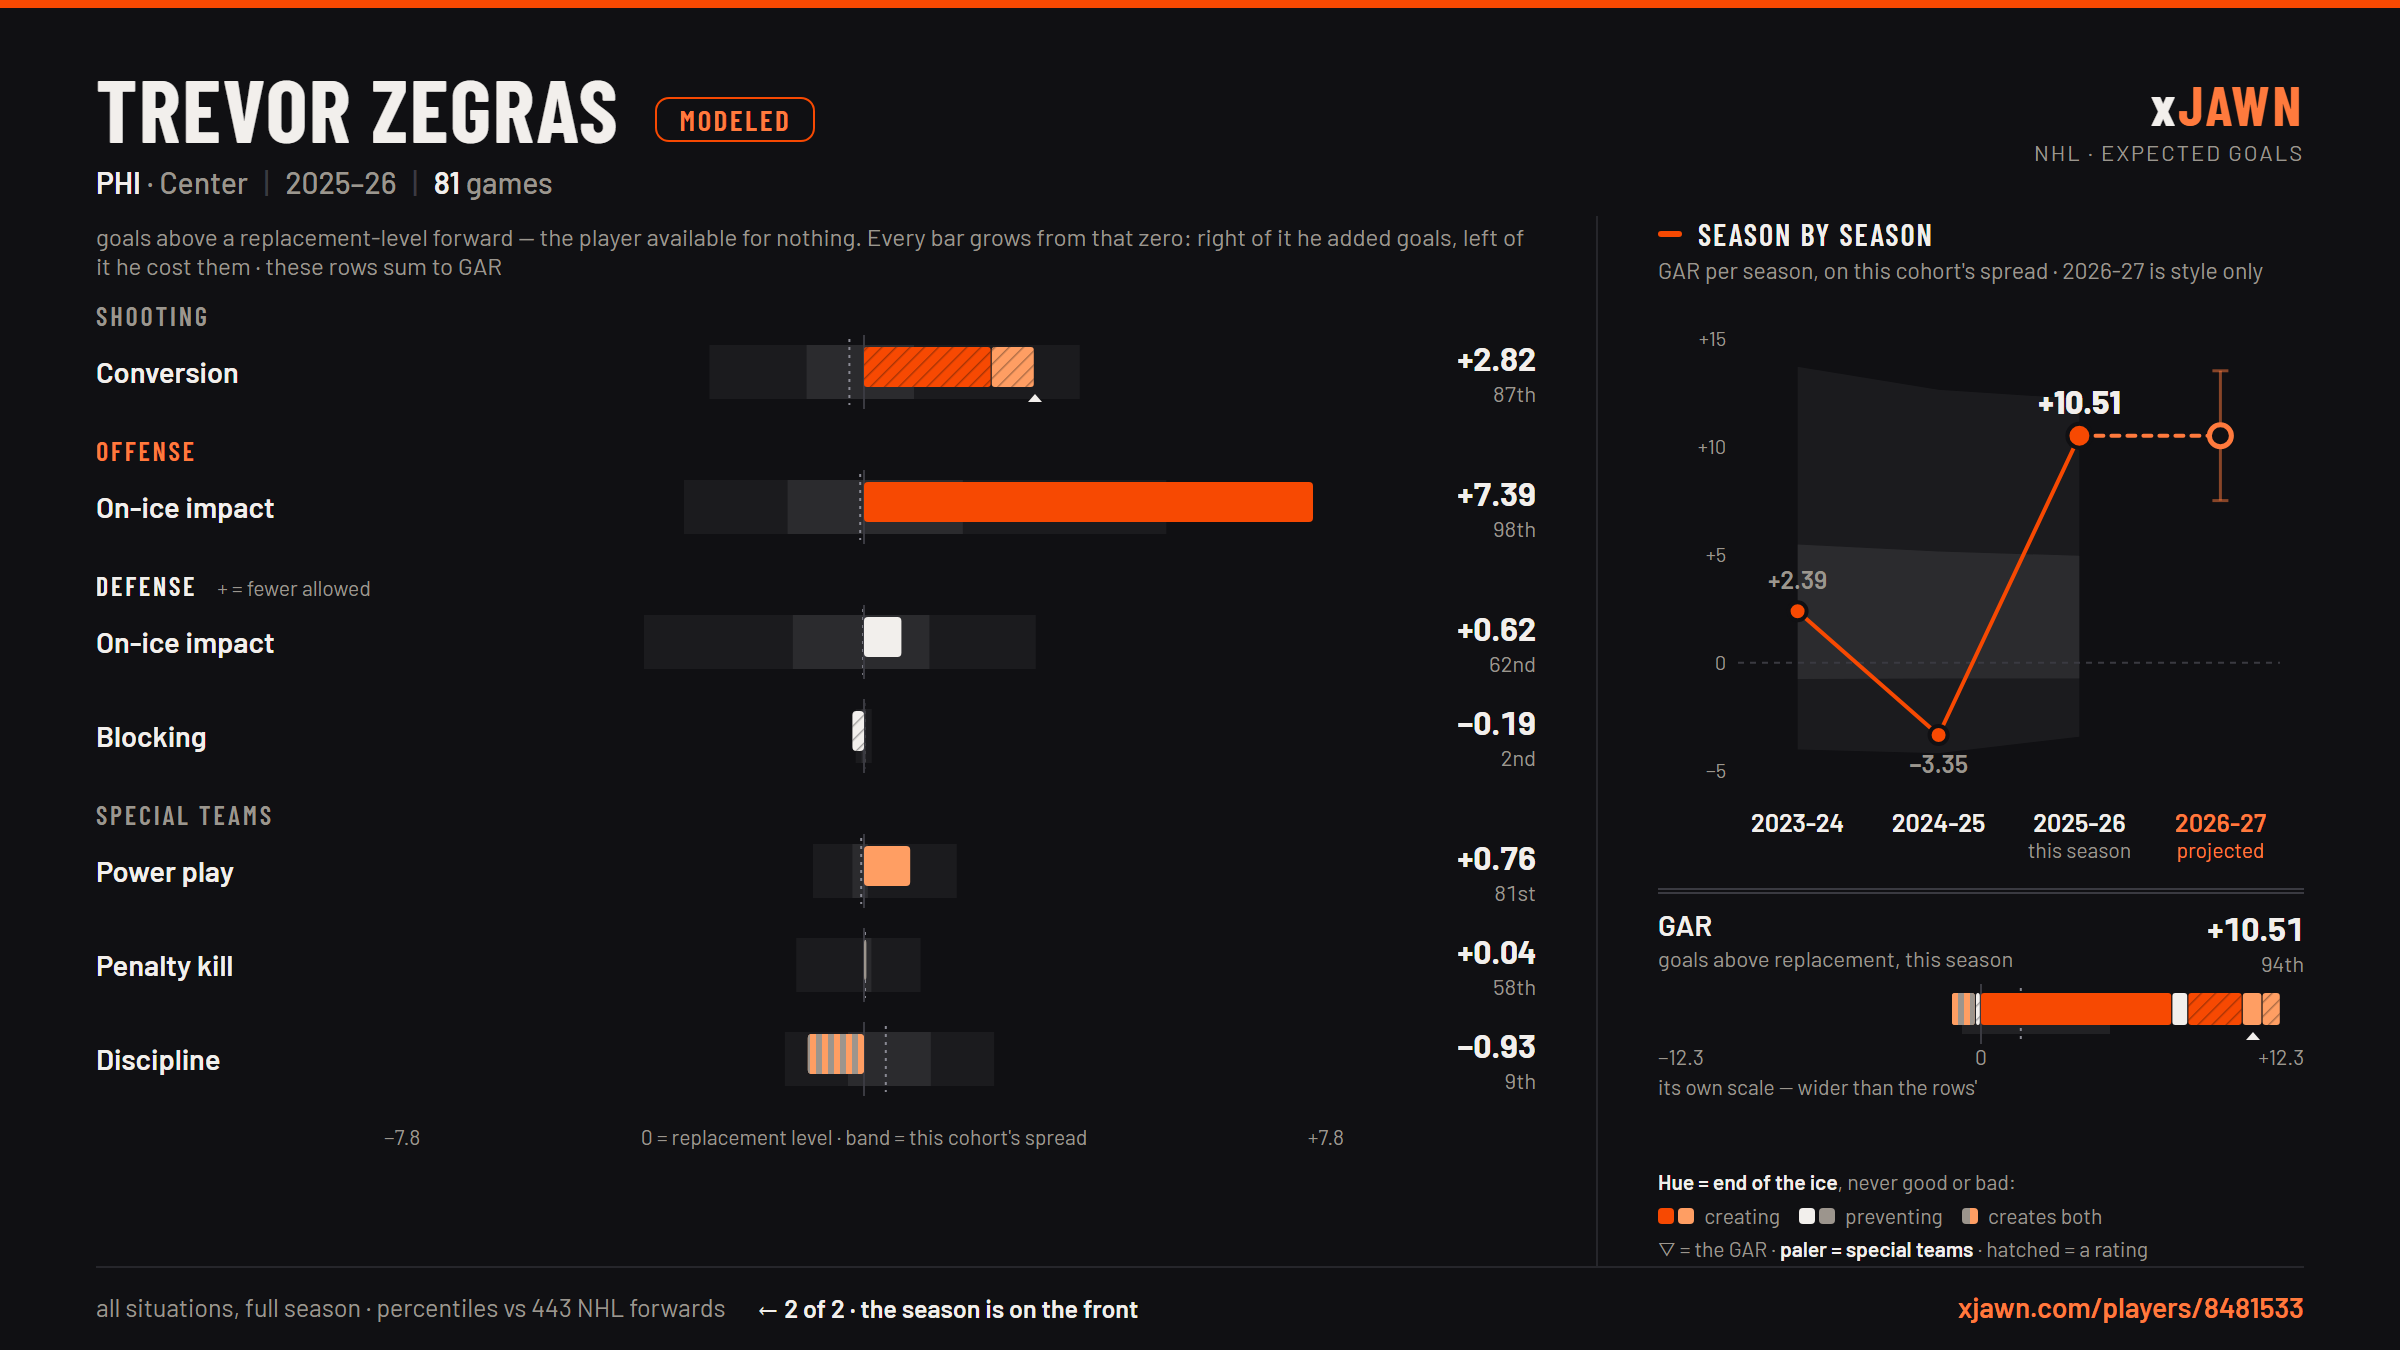
Which is the actual conclusion. Whether Zegras should play center is a question about everything except the dot — who he plays with, what happens at five-on-five, how the lineup shakes out behind him. We showed in the spring that one season of data cannot settle that question for anyone, and nothing here changes it. What this post does is take the faceoff objection off the table at its true weight: around two goals a year, hedgeable to one, against a player worth ten.
What this does and doesn't say
- The value is the puck's, not the man's. 0.0144 xG is what possession off the draw is worth; it is measured by comparing won and lost draws between matched takers, and it inherits the units of our expected-goals model.
- The zone mix is already sheltered: 50% of his draws were in the offensive zone and only 69 all season were in his own end. Since offensive and defensive draws are worth the same per draw, sheltering him by zone does not save anything; sheltering him by taker — the hedge above — does.
- Regression cuts both ways. The model's .429 is the best forecast we have, but his line has fallen five straight seasons. If you believe the trend over the shrinkage, use the left-hand column.
- Special teams are inside the average. The 0.0144 figure pools all strengths; at five-on-five a draw is worth less, and a power-play draw more. If a center-Zegras takes his line's power-play draws, those are the expensive ones.