What is a faceoff worth?
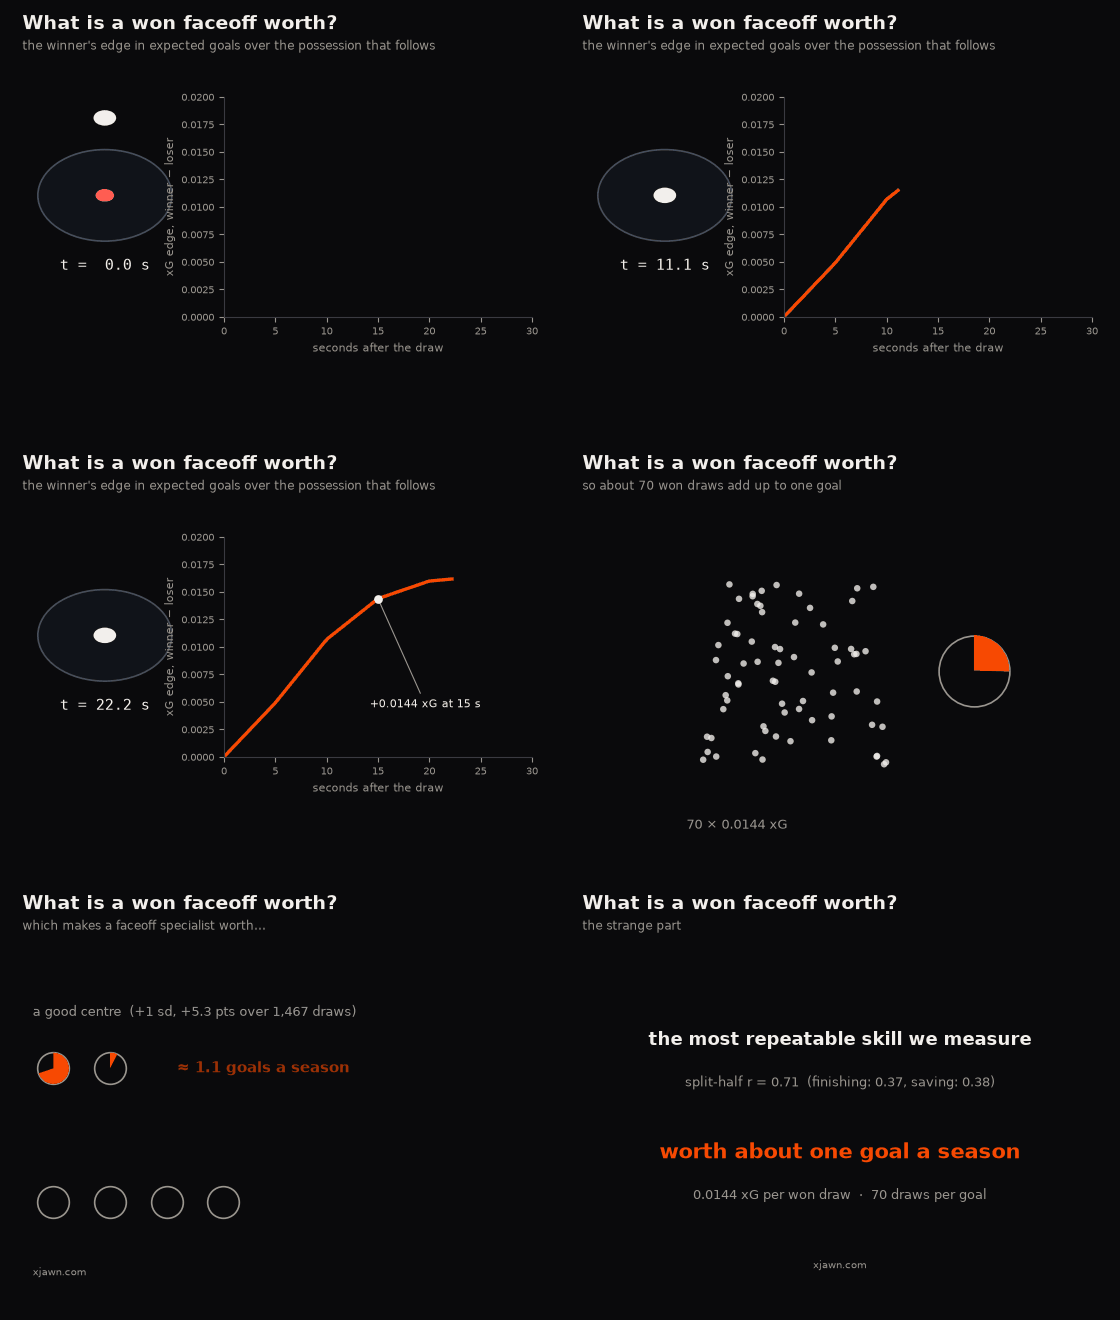
0.0144 expected goals per won draw, measured with the model's own win probability standing in for a coin toss. Seventy extra wins make a goal, an elite center is worth about one a season — and faceoff ability is the most repeatable skill we have ever measured. Both things are true.
Faceoff percentage is on every broadcast, in every box score and in every argument about who the real "two-way center" is, and the analytics answer to it for a decade has been a shrug: it's mostly noise, and even where it isn't, it barely moves a game. That shrug quietly bundles two different claims. Is winning draws a skill? And is a won draw worth anything? We measured both, over 1.2 million faceoffs, and they came back with opposite answers. This is the second one, because it's the one that tells you how much to care.
0.0144 expected goals
A won faceoff is worth 0.0144 expected goals: the winning side's xG minus the losing side's over the fifteen seconds that follow the drop. That is the headline, and the interesting part is how you get a number like that to mean anything, because the obvious objection is obvious — good teams win draws and generate chances, so comparing "after a win" to "after a loss" across the league just measures who the good teams are.
The way out is the faceoff model itself. It predicts the probability that a given taker wins a given draw — both players, the dot, handedness, size, fatigue, strength state — and it is calibrated: when it says 55%, the home taker wins 55% of the time. So within a group of draws the model rates the same, the actual outcome is very nearly a coin flip, and comparing won against lost inside that group is comparing like with like: same quality of taker on both sides, same situation, different coin. Do that across ten bins and pool.
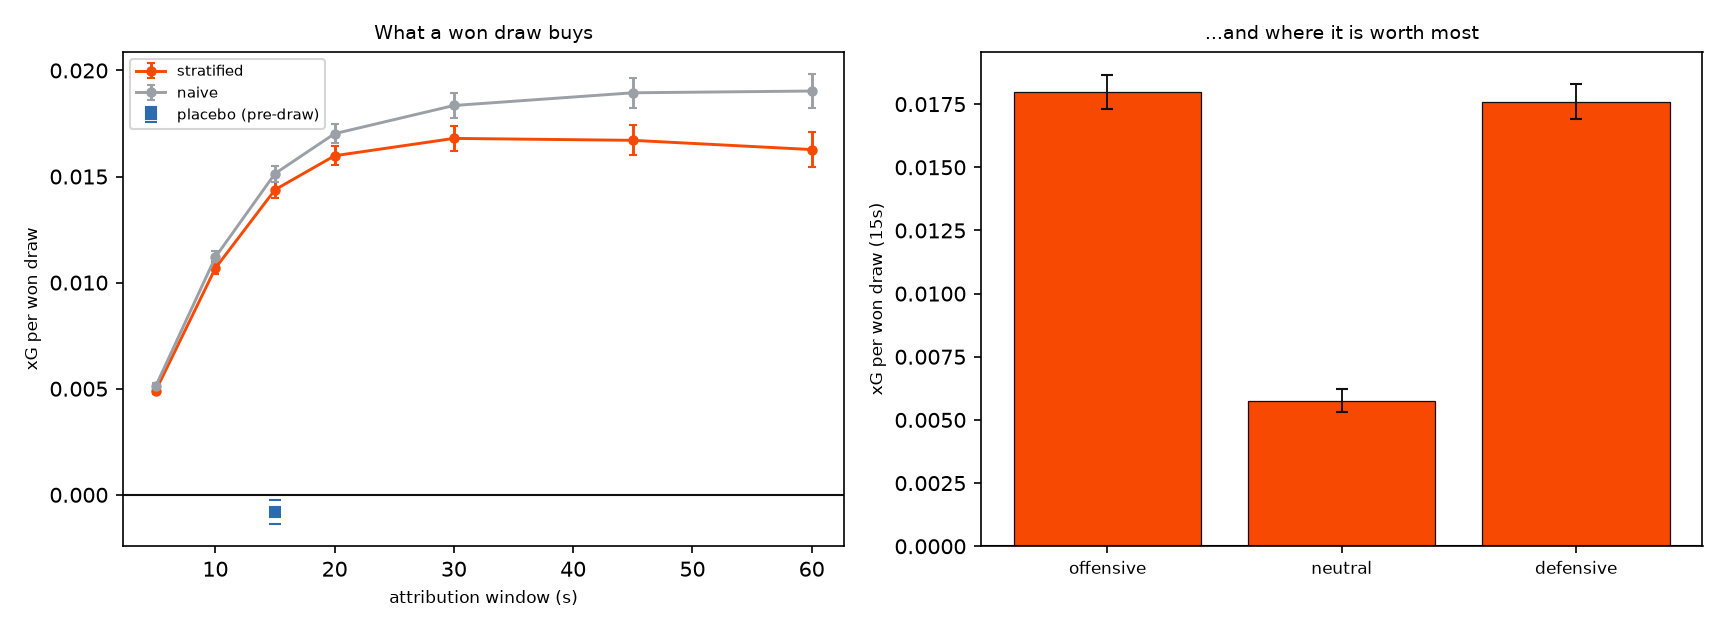
Two checks say the number is honest. The unadjusted version is 0.0151, so the confounding everyone worries about turned out to be worth five percent of the answer. And the placebo — run the identical estimator on the seconds before the draw, where the outcome cannot possibly have caused anything — comes back at −0.0008: essentially zero, and the wrong sign for a bias that would inflate the result.
The clock matters too. The edge rises steeply to fifteen seconds, saturates near 0.017 by thirty, and is flat after that. Whatever a draw buys you, you have spent it within half a minute.
Seventy draws make a goal
Divide one by 0.0144 and you get the number worth carrying around: about 70 extra won draws add up to one goal. Not seventy draws — seventy more wins than the other guy would have had at the same dots.
Where the draw is worth most is a surprise. The offensive-zone draw (0.0180) and the defensive-zone draw (0.0176) are worth the same, and the neutral-zone draw about a third of either (0.0058). That is the physically sensible answer once you see it: at one end you win a chance, at the other you deny one, and in goal-differential terms those are the same transaction. At five-on-five alone the value drops to 0.0113, so the expensive draw in the league is a power-play draw in the offensive zone.
So what is a faceoff man worth?
Take a first-line center's workload — 1,467 draws, the ninetieth percentile of the league's regular takers — and a good one, one standard deviation above the league on our fitted skill scale, which is 5.3 points of win rate. That's 78 extra wins, or 1.1 goals a season. Stretch it to the whole distance between the best regular taker and the worst (0.555 against 0.400, the 95th and 5th percentiles) and it is 3.3 goals.
Two real players, last season, to make it concrete. Vincent Trocheck won 56.9% of 1,099 draws — 98th percentile of every active taker in our model — and that was worth +1.1 expected goals over an average taker. Jack Hughes won 34.8% of 417 — 8th percentile, genuinely one of the worst in the league — and that cost New Jersey 0.9 expected goals. Part of why it cost so little is that he only took 417: the league already routes around bad takers, which we'll come back to.
An elite faceoff man is worth about a goal a season on the dot. The whole league's spread, best to worst, is about three.
The strange part
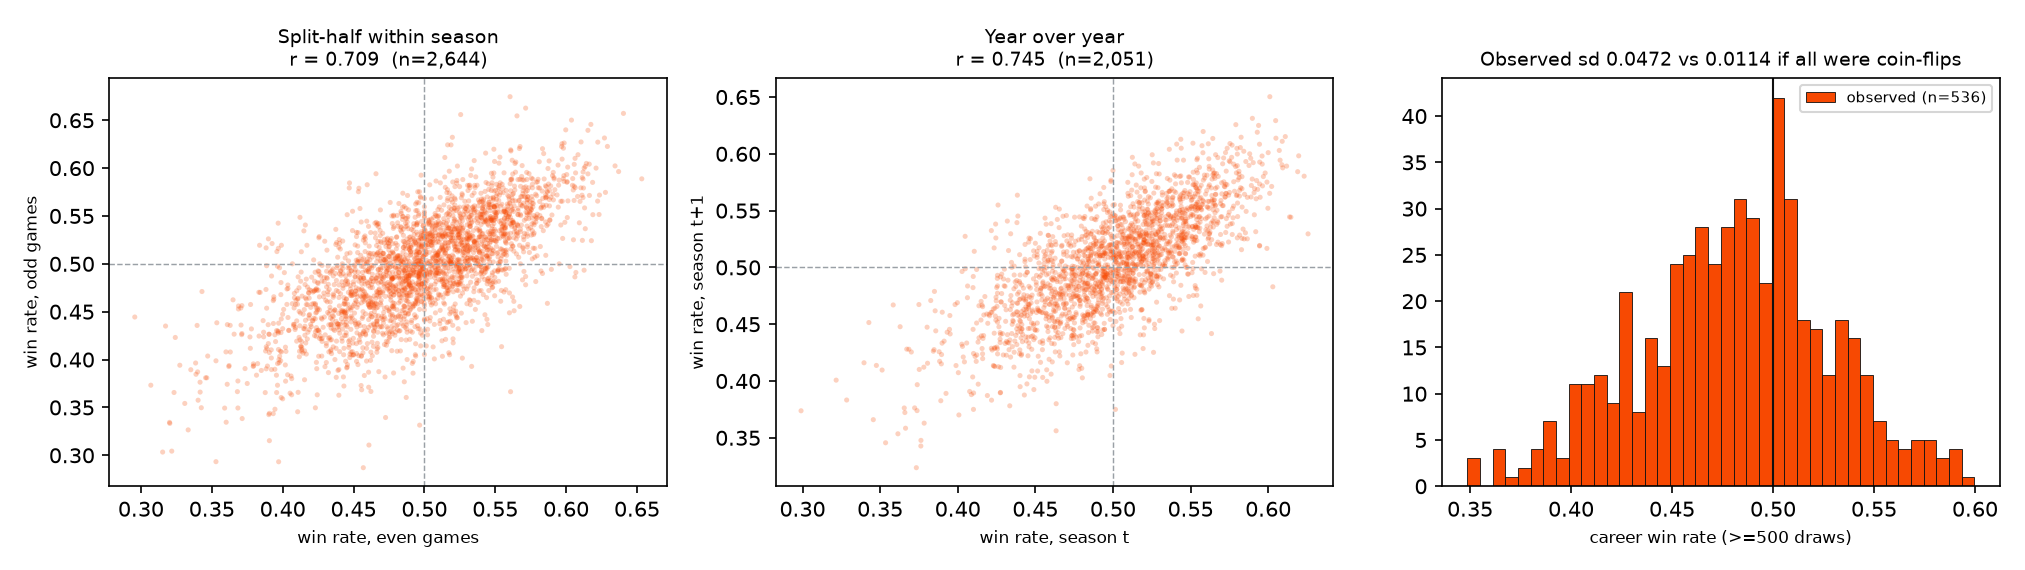
Here is what makes faceoffs a genuinely odd corner of the sport. Split any player's season into odd and even games and rate him twice: for faceoffs the two halves agree at r = 0.71. Finishing — a shooter beating the expected-goals model — comes in at 0.37 on the same test. Goalie saving, 0.38. Shot blocking, 0.50. Year over year, faceoffs are 0.75. Of the observed spread in career win rates, 94% is real skill; pure coin-flipping at the same sample sizes would produce a quarter of the width we see.
Faceoff ability is the most persistent skill we measure, and one of the least valuable. Those are different axes. Faceoffs sit at the extreme of one and the bottom of the other, and most of the confusion about them comes from assuming that because you can see the skill so clearly, it must matter a lot.
Coaches already know
We also priced the coach's decision — half a million of them, over four seasons: every draw where a better faceoff option was available, either on the ice or rested on the bench, with the draw-value gain on one side and the cost of the line change on the other, both in goals. Sending the better taker would have helped in 56% of bench decisions, which sounds like an inefficiency until you see the stakes: under a thousandth of a goal per decision. A coach who played every one of them perfectly all season would bank two or three goals.
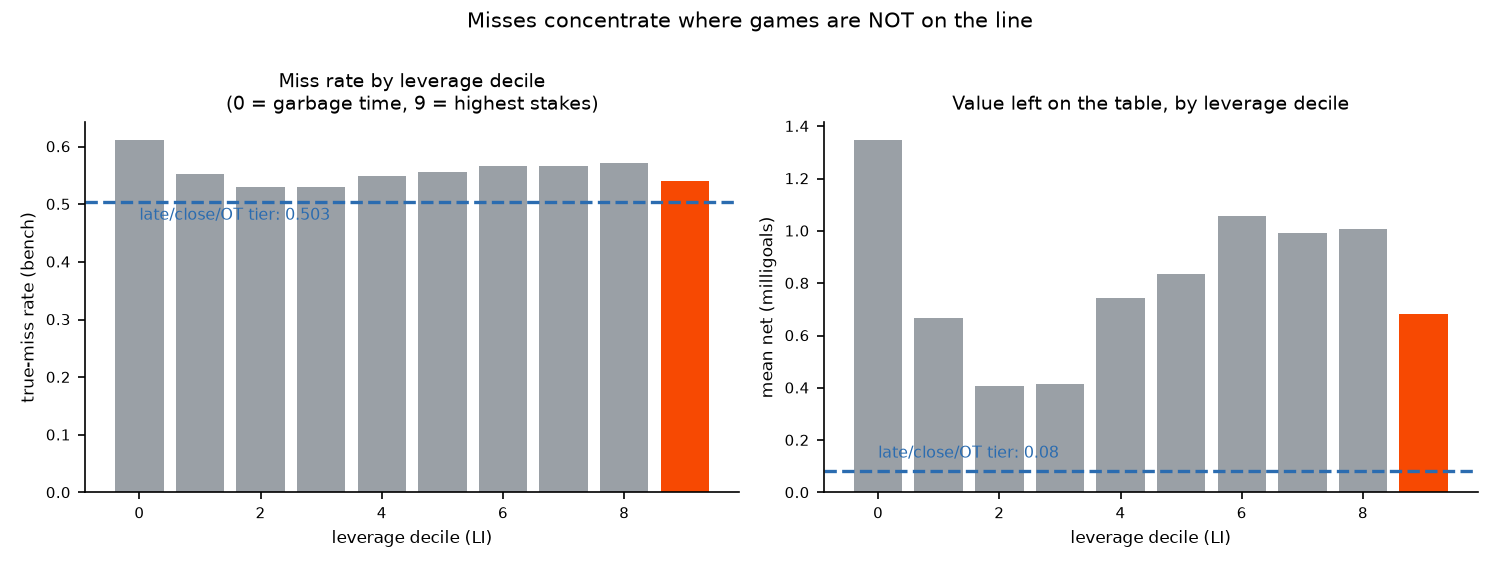
And sort those decisions by how much the moment matters — the derivative of an in-game win-probability model — and the value left on the table in late, close and overtime situations drops to a hundredth of that: nothing. Fit a choice model to what coaches actually do and the weight they put on the draw relative to skater quality is about 0.03 — they treat the choice of taker as a faceoff-only decision, made among the players already on the ice, and they make that choice very well. The league has priced the faceoff at roughly what it is worth. It just never wrote the number down.
One more thing we looked for and didn't find: a clutch faceoff man. The cheap version of that stat — a player's win rate in big moments versus overall — is guaranteed to paint the best centers as chokers, because both benches send their best man out in those moments and he faces a tougher opponent. Adjust for the opponent and nobody repeatably beats his own expectation when it matters; the instrument could have seen an effect about 80% the size of the ordinary skill spread, and there isn't one.
What this doesn't say
- It is the value of the puck, not the man. A won draw is worth 0.0144 xG whoever won it. The specialist's other jobs — the penalty kill, the defensive-zone minutes he gets because he can be trusted with the draw — are not in this number.
- The units are our expected-goals model's. A better xG model moves the number a little; nothing plausible moves it by a factor that changes the conclusion.
- It's a fifteen-second window, closing at the next whistle — chosen because the curve is flat after thirty and the next faceoff would otherwise be credited twice. The thirty-second number is 0.017, and the conclusion is the same.
- "Worth little" is not "worth nothing." A goal a season is a goal a season, and in a league decided on the margin it has a price. The claim is about the size, not the sign.