Player ratings that move every night
Our player ratings were built to be steady, and steady was slow: a player's rating this season was last summer's number. The new ratings update after every game, carry their own margin, and call games better than the old model in 11 of 12 seasons. Zegras's first Flyers season is the worked example.
TL;DR. Our player ratings used to be fit once a year on three seasons of games. That made them steady, and it made them slow: a player's rating this season was last summer's number. The new ratings update after every game and carry their own margin of error. Built up into team ratings, they call games better than the old model in 11 of 12 seasons, and a quarter of the way into a season they see the rest of it coming better than the standings do.
What steady cost us
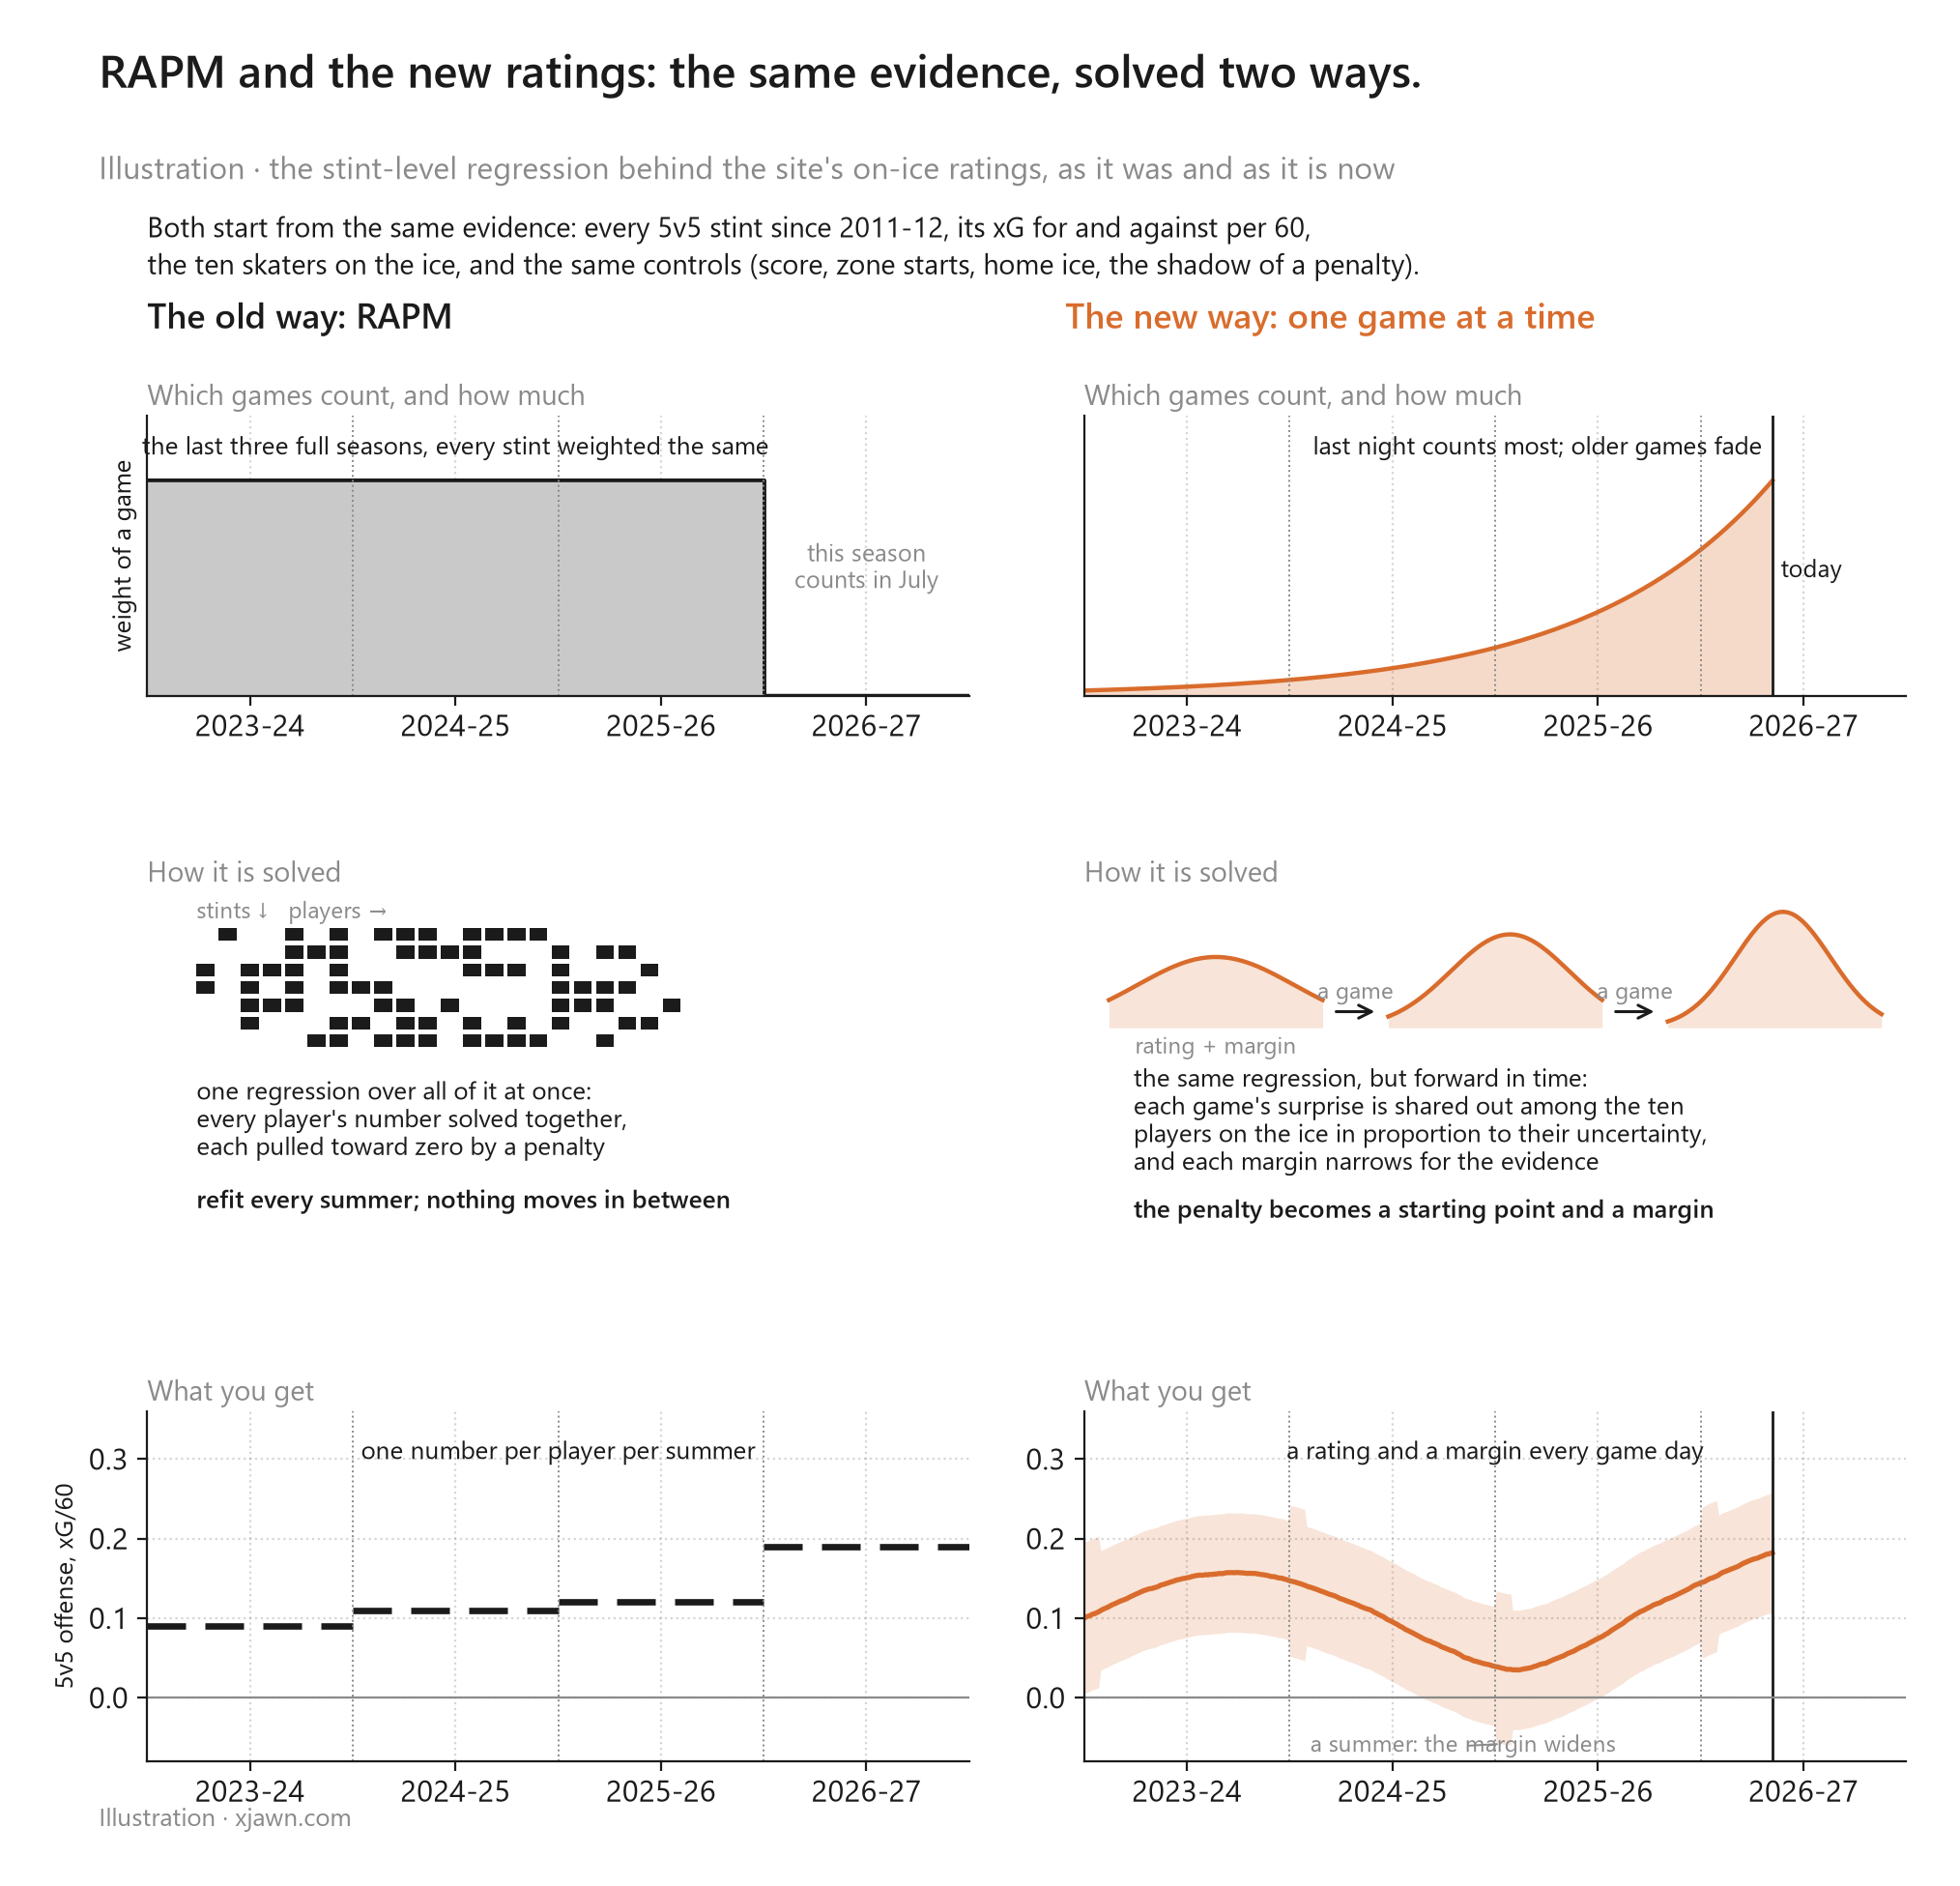
The old rating was a three-season average, refit every summer. Between summers it did not move. If a player got better in October, the site found out in July.
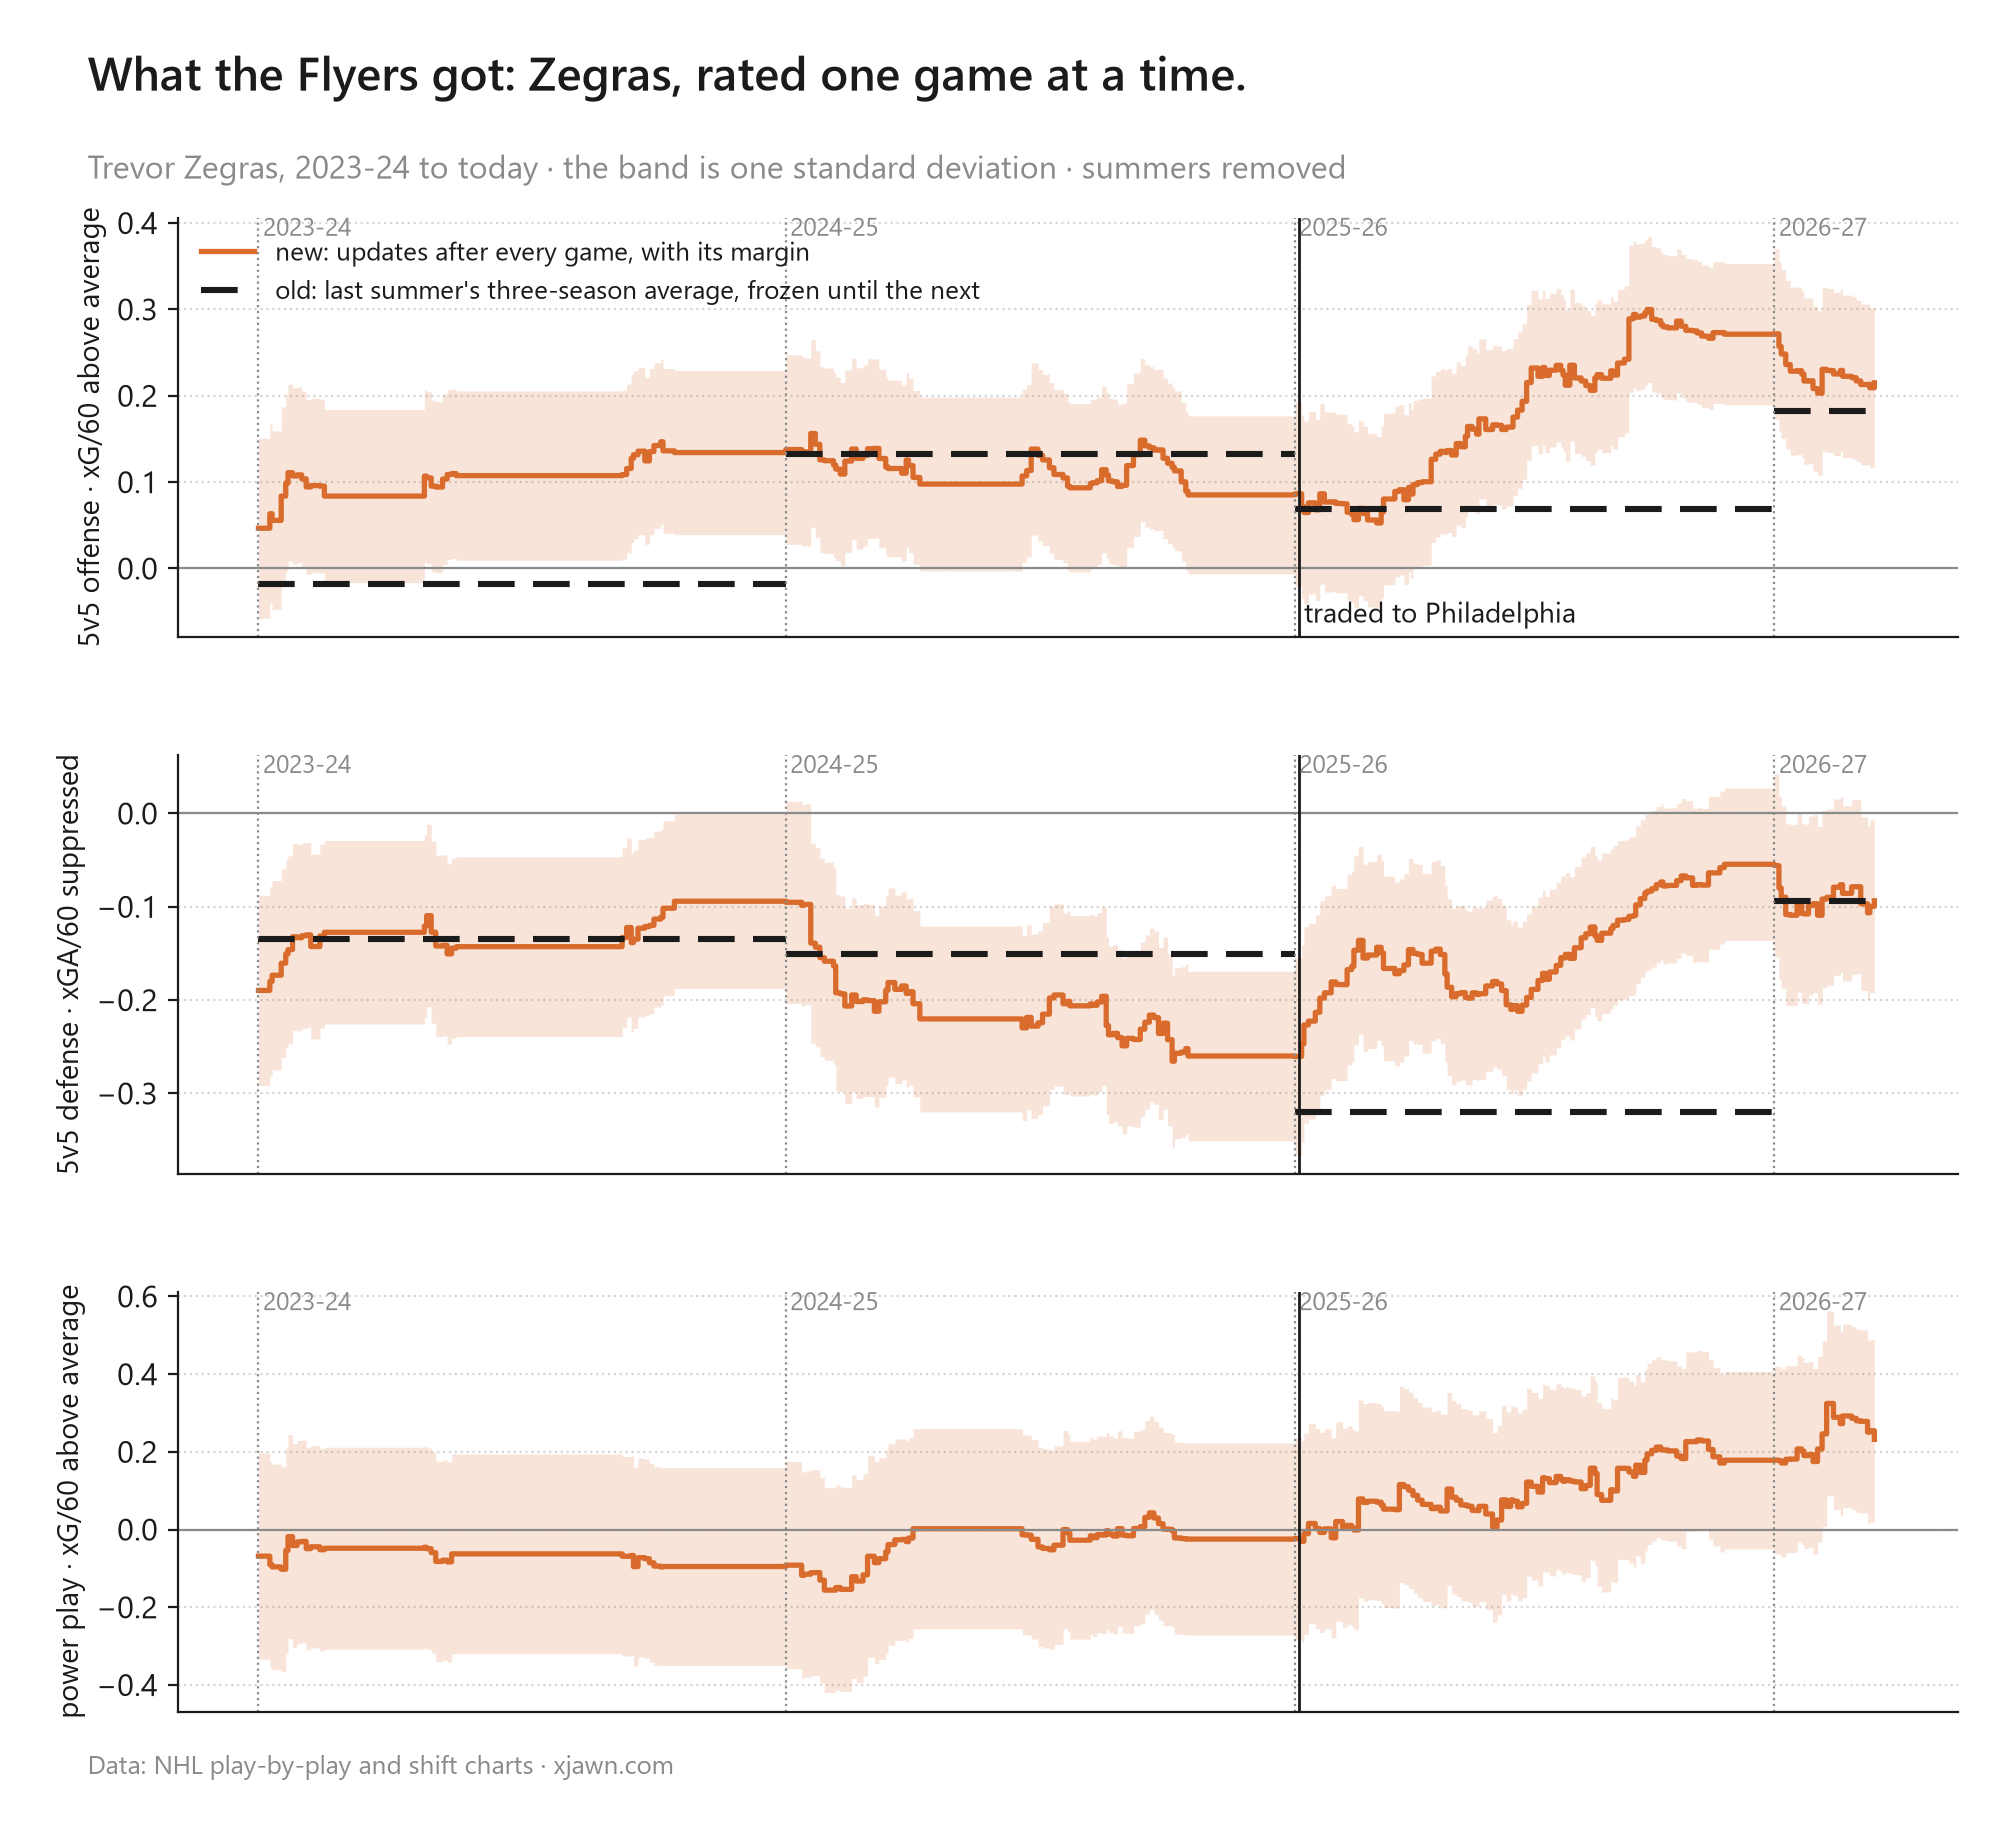
Trevor Zegras is the case this site has already spent three posts on (where he played, whether it mattered, what his faceoffs cost), and it is the clearest case I have for this post. All of last season the site rated his 5v5 offense at 0.07 xG per 60 above average and his 5v5 defense at -0.32, both the numbers from the summer before, both frozen. The new rating watched a different season. His offense climbed from 0.09 to 0.27. His defense, a real liability in Anaheim, went from -0.26 to -0.05, close to average. His power play went from nothing to +0.18. At his minutes the offense gap is about 4 goals over a season and the defense gap about 6, and the old numbers could not see either until the season was over. The summer refit then moved to 0.18 and -0.09, most of the way to where the new rating had been for months.
Stability was the point of the old design. A rating that barely moves is hard to fool with a hot month. But a rating that cannot move is also wrong for months at a time, in a direction you can see coming, and that is a cost you pay every time you use the ratings to predict a game.
How the new ratings work
The evidence is the same evidence RAPM uses. The on-ice ratings on this site have always been RAPM: cut every game into stints, the stretches where the ten skaters on the ice do not change; measure each stint's chance volume, the xG for and against per 60 minutes; then solve one large regression for every player's effect at once, with controls for score state, zone starts, home ice and the shadow of a penalty, and a pull toward zero so that a player with few minutes does not get a wild number. Three seasons at a time, refit every summer. The new ratings use the same stints, the same target and the same controls, 5.1 million 5v5 stints since 2011-12. What changes is how the regression is solved: forward in time, one game at a time, instead of all at once.
The target is chance volume times chance quality, before anyone shoots. xG per 60 is the number of attempts a lineup generates weighted by how good each one was. A player's on-ice rating says how much of that his presence adds or suppresses. Finishing is kept out of it on purpose and rated separately, per shot, as goals above what the shot was worth; a goalie's saving the same way from the other side. The power play and the penalty kill get their own on-ice ratings on their own stints. Everything stays in the units it was measured in: xG per 60 for the on-ice ratings, goals above expected per 100 attempts for finishing and saving.
The update. Before a game every player has a rating and a margin. The ten ratings on the ice, plus the controls, predict each stint's chance rate for both sides. After the game, the surprise on each stint, what happened minus what was expected, is shared out among the ten players in proportion to how uncertain each one's rating is, and each margin narrows a little for the evidence. A player with 900 games behind him takes a sliver of the surprise; a rookie takes a lot. Statisticians call this a Kalman filter; it is the arithmetic a GPS uses to combine where it thought you were with the fix it just got.
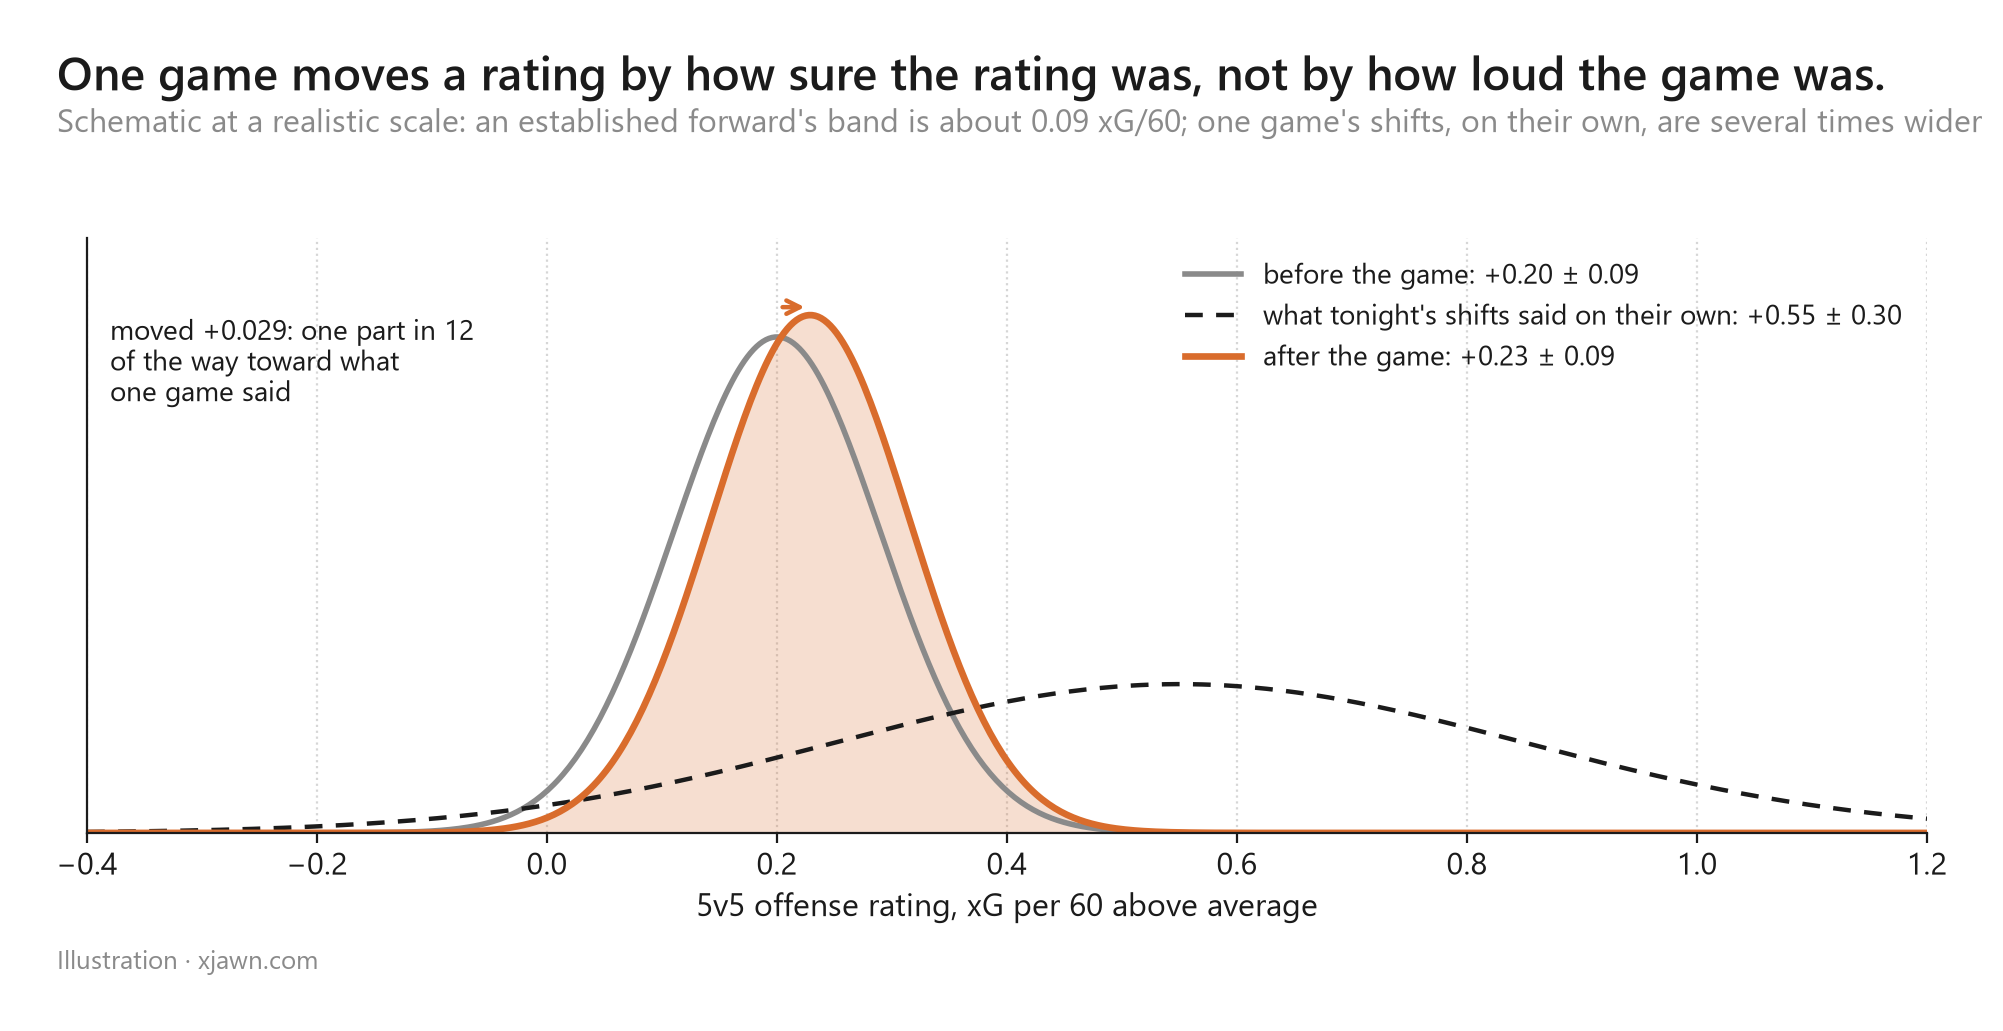
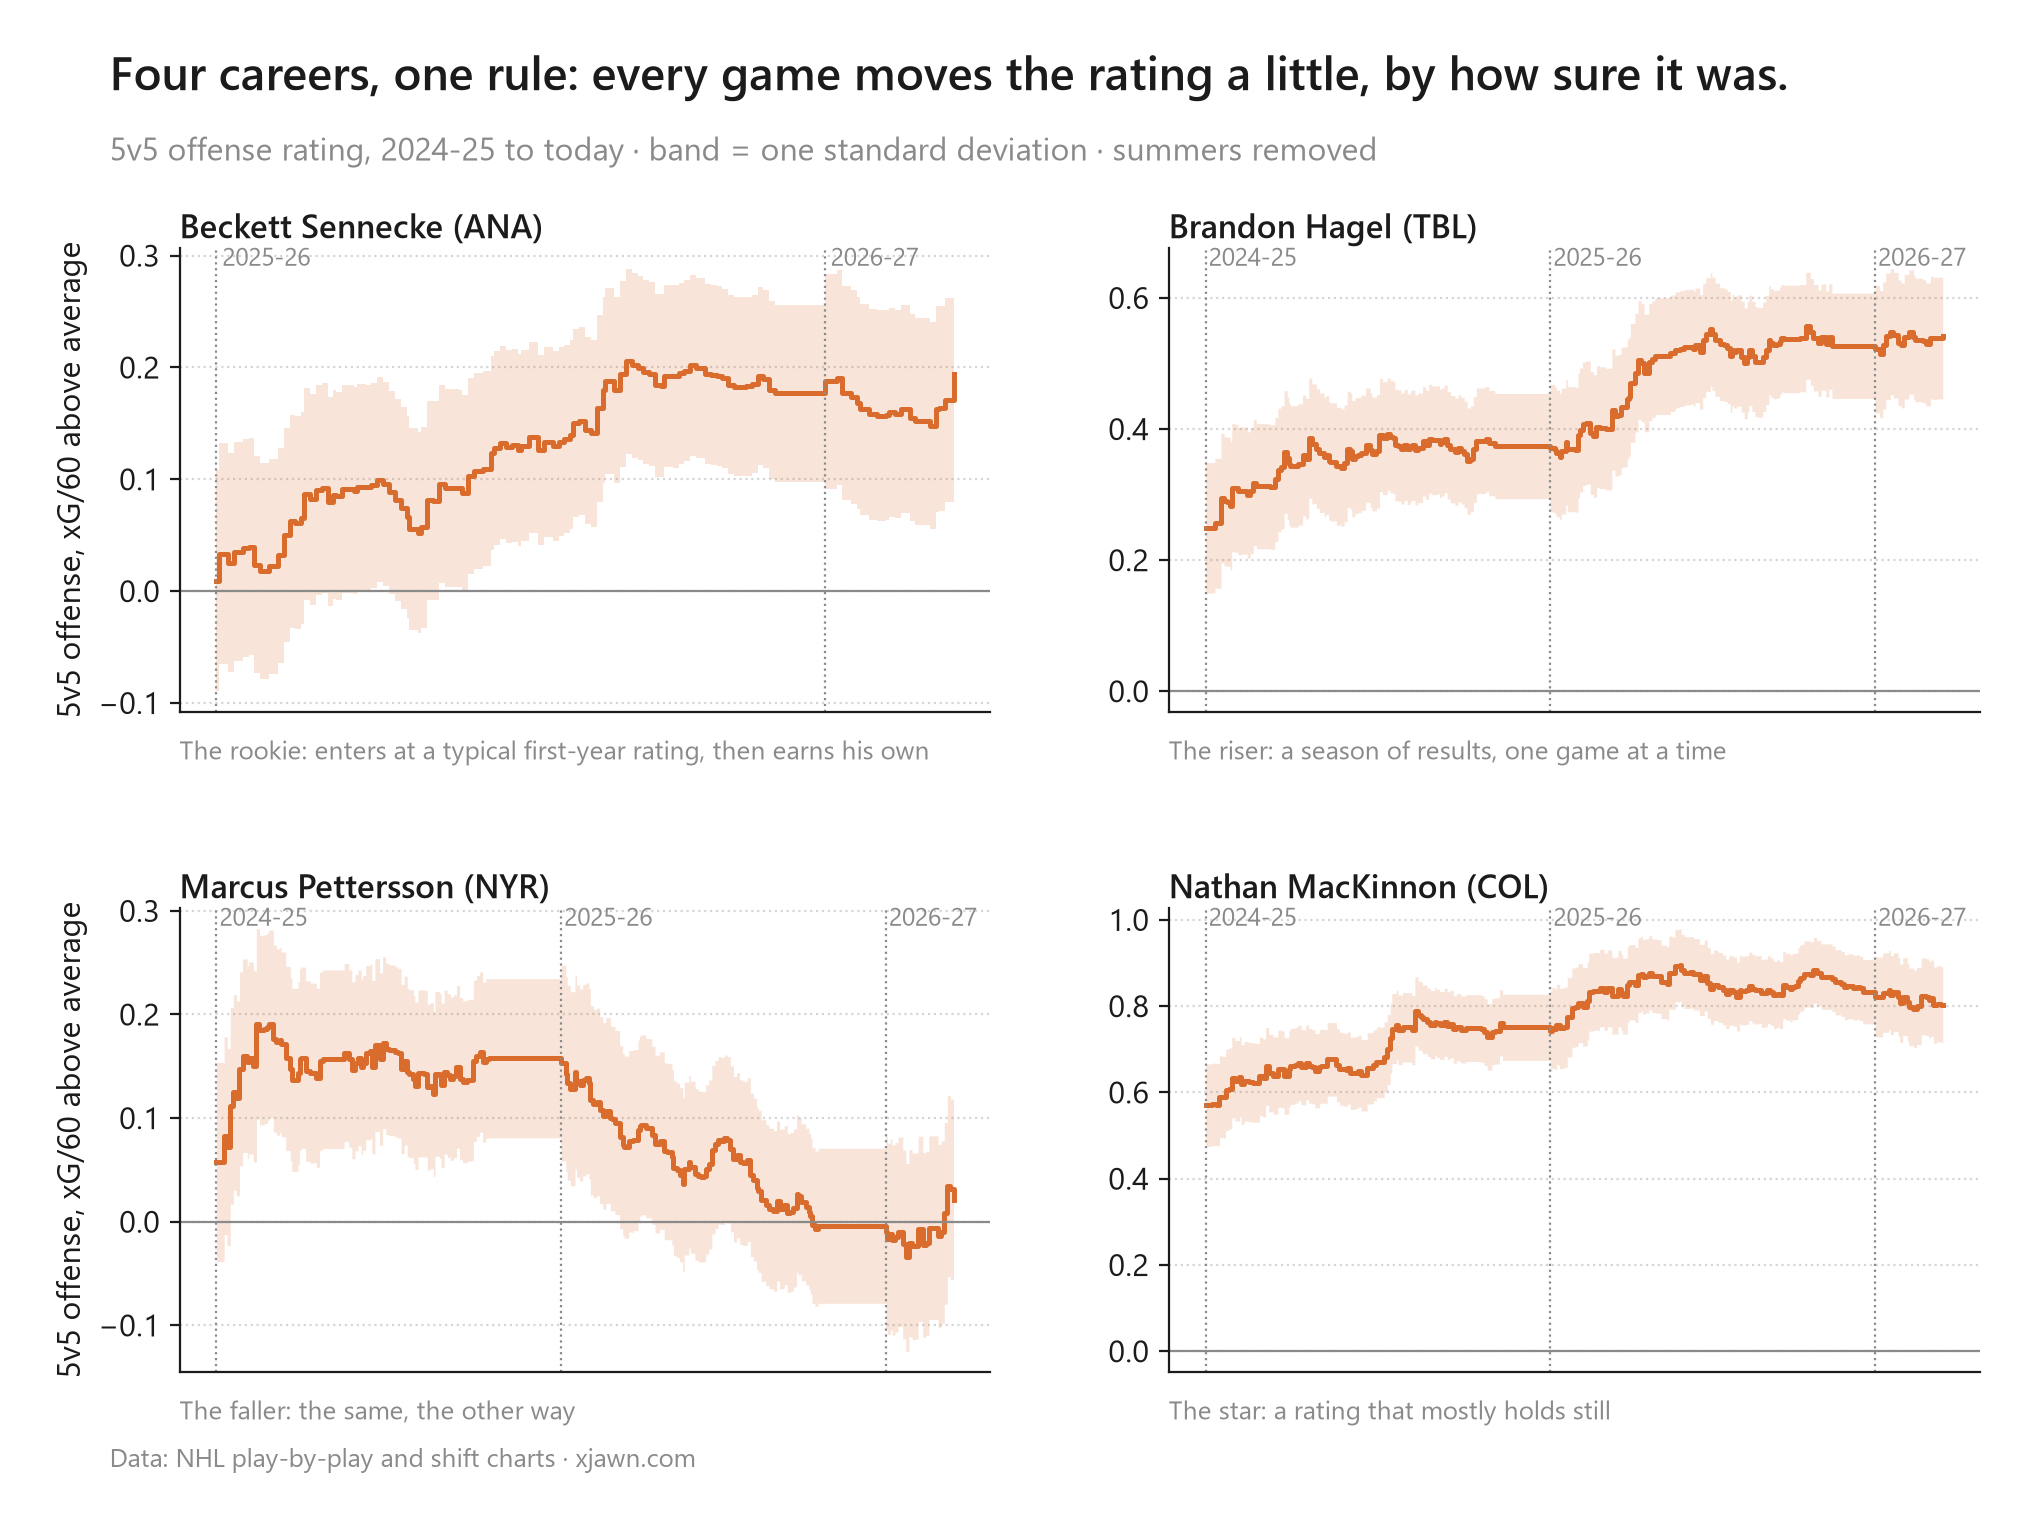
What RAPM's pull toward zero becomes. In RAPM the shrinkage is a penalty the fit chooses. Here the same job is done by the starting point and the margin. A first-year player starts at the typical first-year rating for his position, with a wide margin, and earns his own number from there. Old evidence fades instead of falling off a three-season cliff: two settings govern how far a rating may drift, a little every game and more over a summer, and they were set by feel before they were checked against prediction. At the settings used, a top forward's offense rating moves about 0.015 xG per 60 over ten games and about 0.04 over a season, and a summer can move it only through aging: every rating ages along the usual curve for a player of that age, and its margin widens, because a summer is a long time to go without evidence.
The margin is part of the rating, not decoration. I checked it against what the players went on to do. For skaters, the season total's margin covers the realized number about 91 times in 100 when it claims 90. For goalies it is 86 in 100. Those are the margins on the site; the margins on the individual pieces (5v5 offense alone, say) are not yet that honest, so the site only shows the one on the total.
A team is its lineup that night
A team's rating is not a separate thing. It is the ratings of the players who dressed, weighted by how much they play, plus two small terms the players cannot carry: a coach term, which moves very slowly, and a franchise finishing and saving term. So the team rating changes when the lineup changes, which is the thing a stable rating could never do.
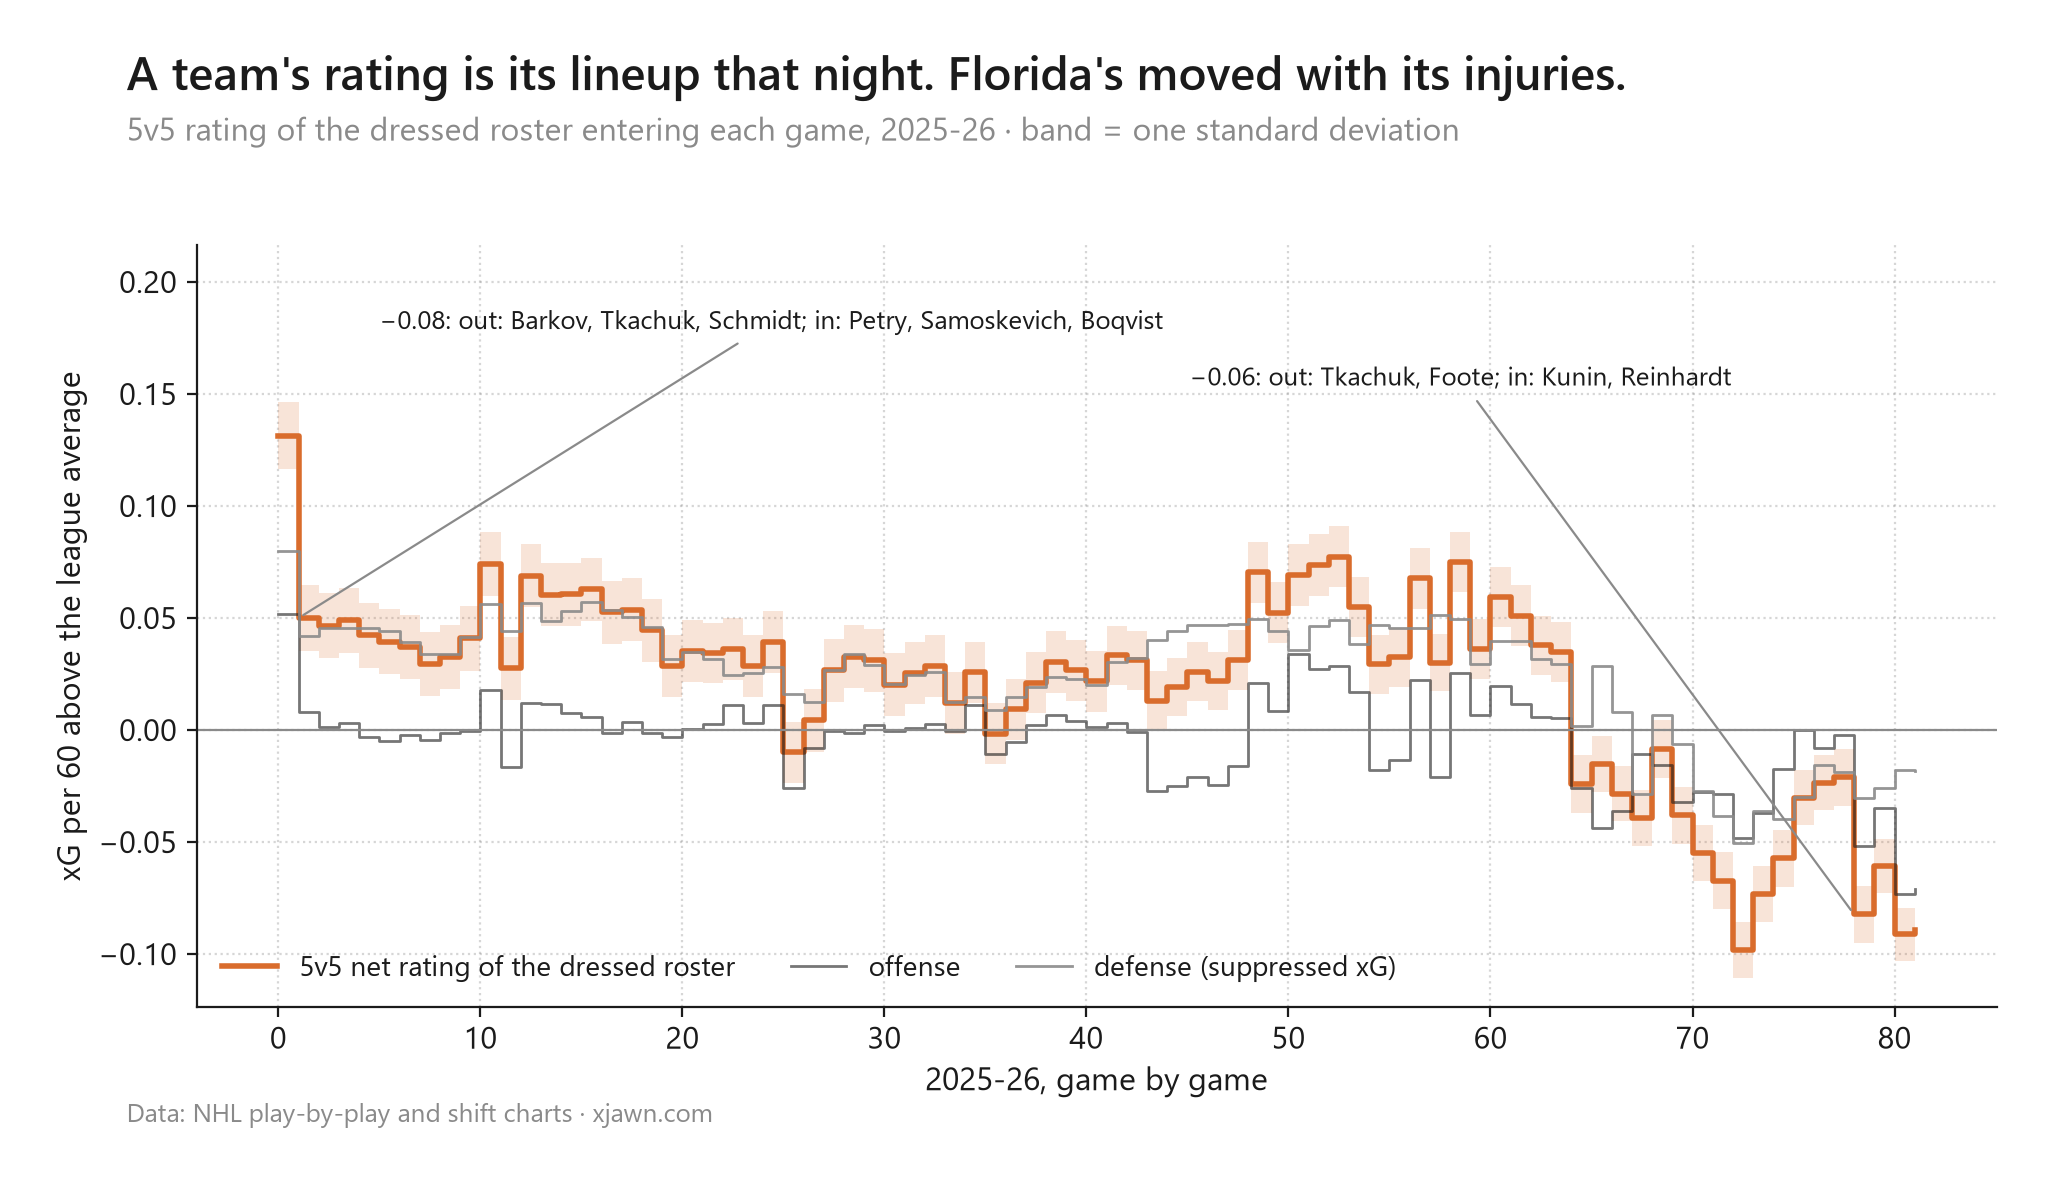
Does it predict better?
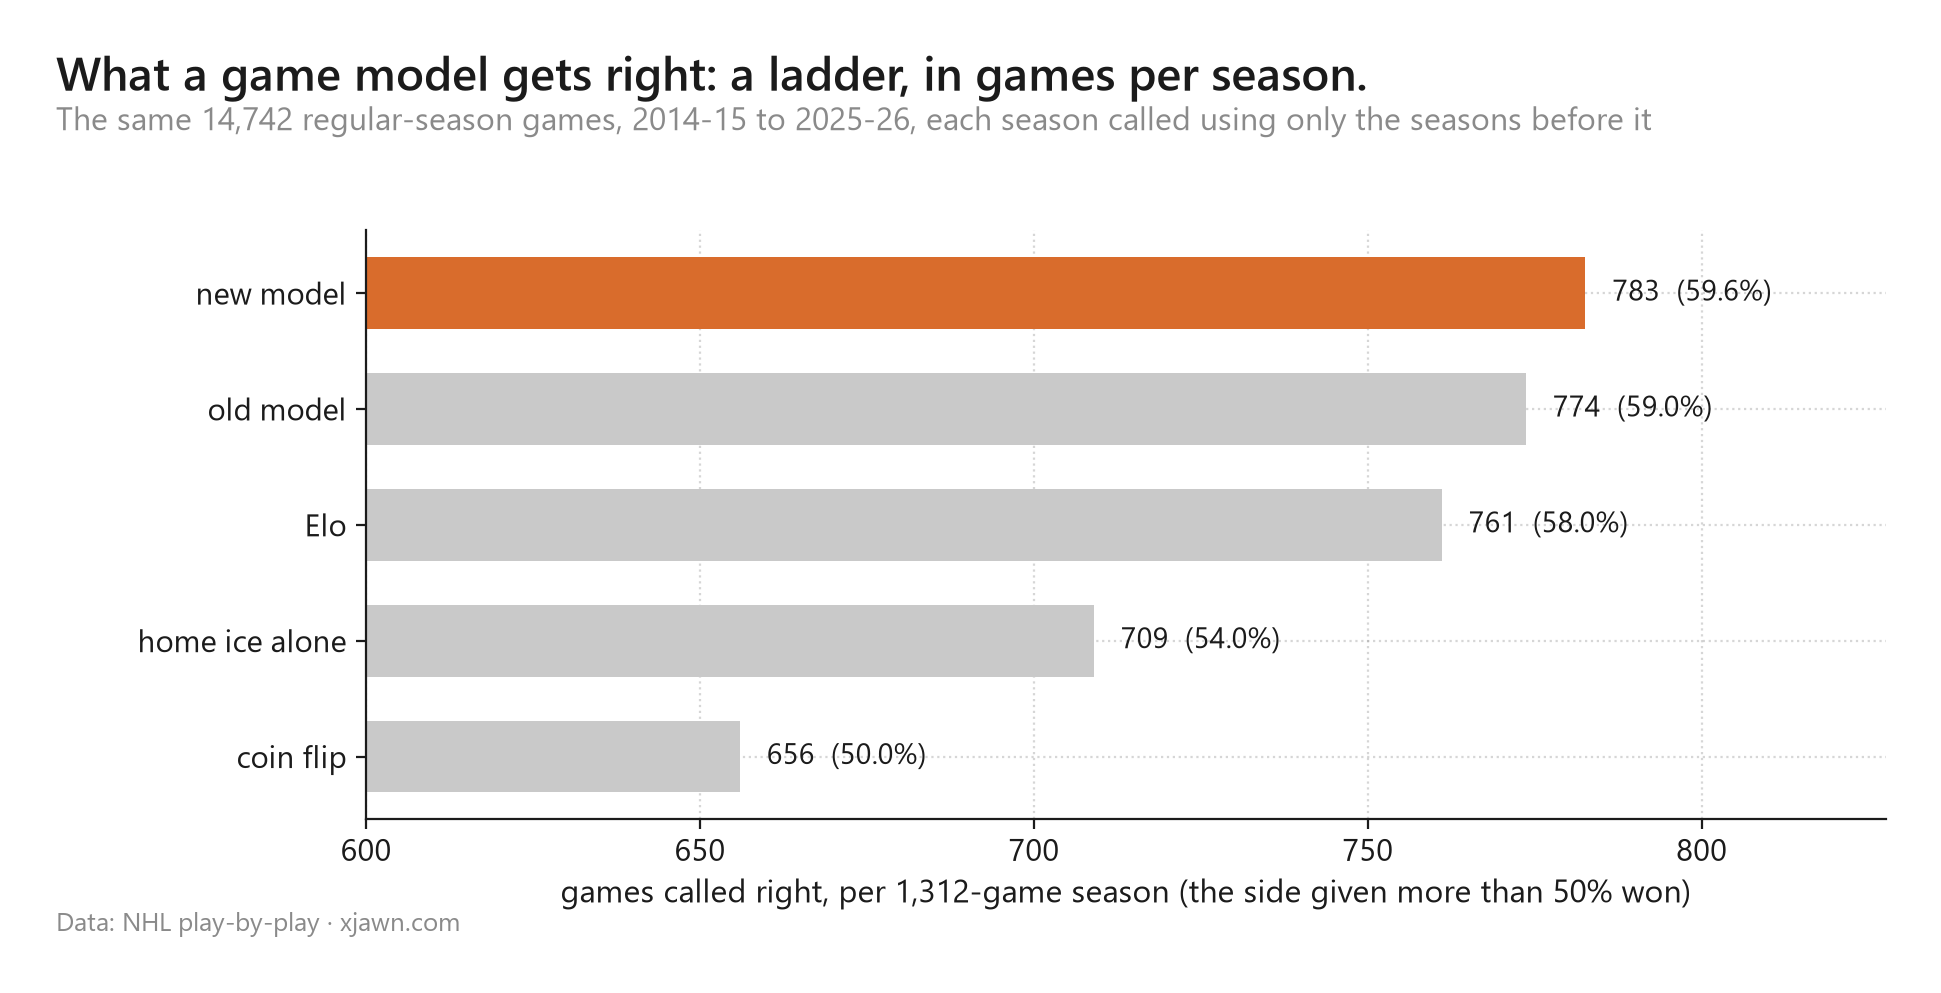
This is the question the whole thing was built to answer, so here is the fair version of the test: for each season since 2014-15, the game model is fit only on the seasons before it and then has to call that season's games. The old model and the new one get the same games and the same rules. The only difference is the ratings underneath. And to keep the sizes honest, here is the whole ladder, in the one unit everyone understands: of the 1,312 games in a season, how many does each way of calling a game get right.
| How you call the game | Right, per 1,312 | Share |
|---|---|---|
| coin flip | 656 | 50.0% |
| home ice alone | 709 | 54.0% |
| Elo | 761 | 58.0% |
| old model | 774 | 59.0% |
| new model | 783 | 59.6% |
Read it from the bottom up. Picking the home team every night gets 709 right. A plain Elo, the kind that only sees who beat whom, gets 761. The old model, built on the three-season ratings, gets 774. The new one gets 783. That is about 9 more games a season, and for scale the old model's own step up from Elo was 13. The two models disagree about the favourite in about 146 games a season, and the new one wins that argument 77 to 69. No rating system turns hockey into a predictable sport; a game is close to a coin flip with a lean, and the whole ladder from home ice to the best model is about seventy-five games a season. What the new ratings buy is a few of those games, almost every year, in the same direction.
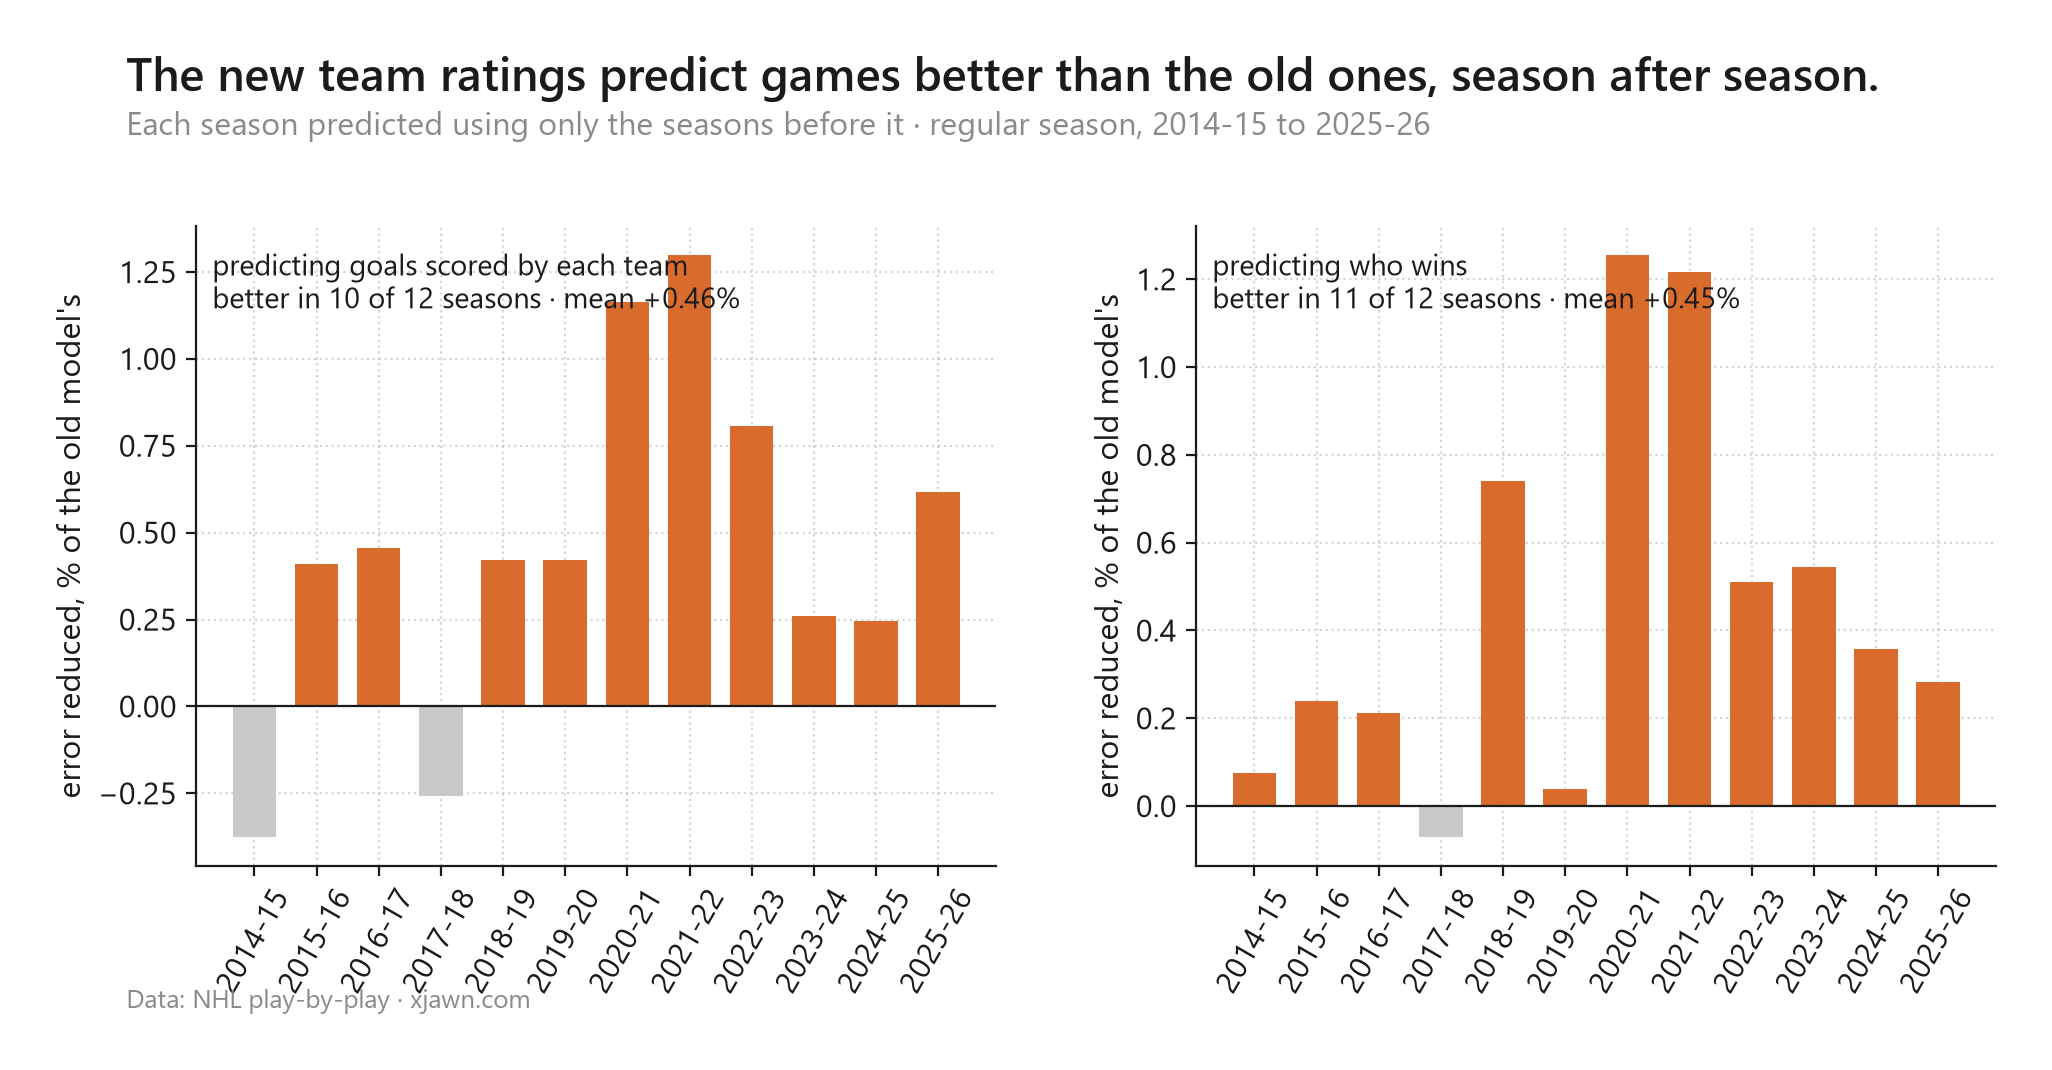
The bigger difference shows up at the team level, early in a season, where lineups matter most and the record matters least.
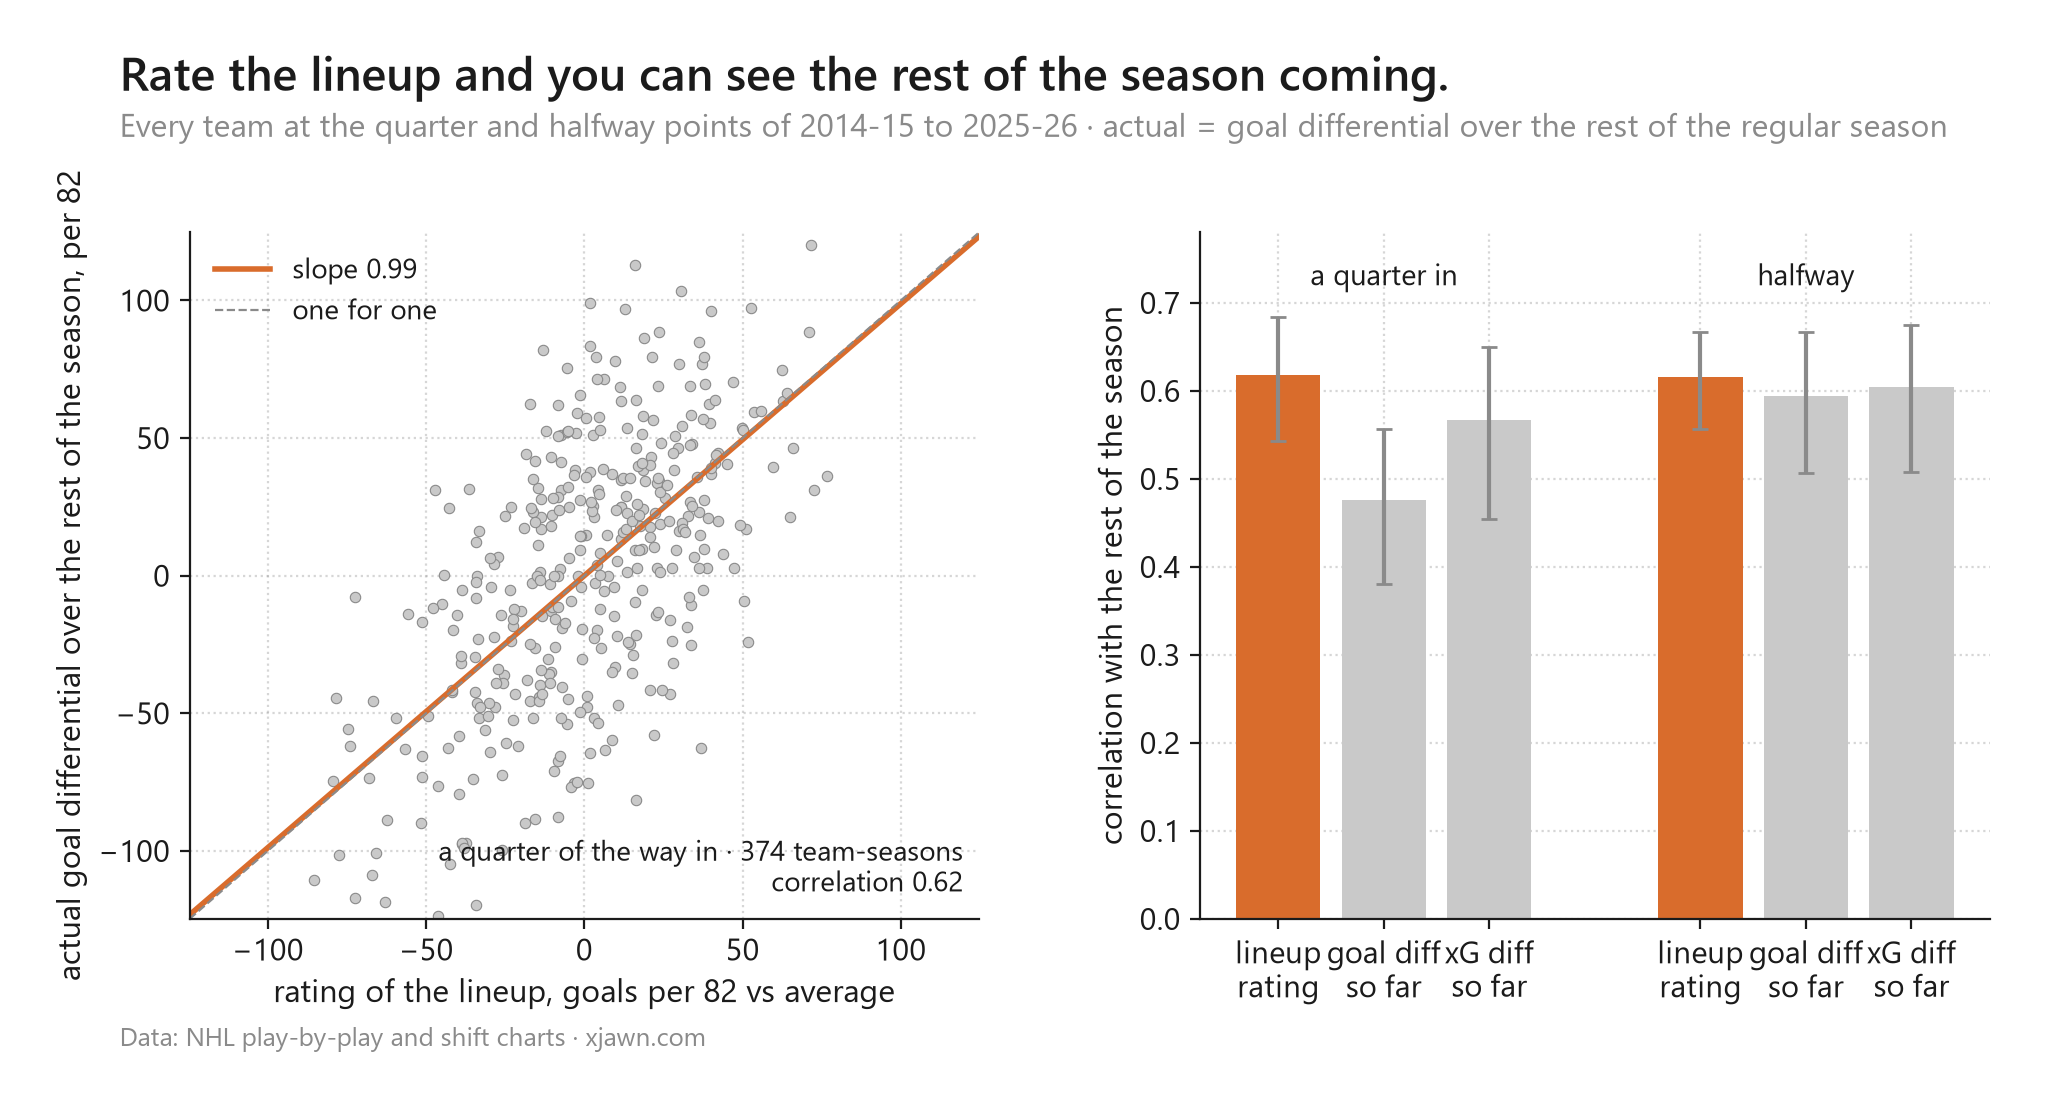
Twenty games in, with sixty to play, the rating of the lineup accounts for 38% of the spread in how the rest of the season goes. The standings, meaning goal differential so far, account for 23%; xG differential so far, 32%. The slope is 0.99, which means the rating is in real goals: a lineup rated 20 goals better than average goes on to outscore its opponents by about 20 more over the next 82 games. By the halfway point the record has caught up and the three are even. Twenty games of results is not much. A rating that already knows who is dressed does not need them.
Who is on top right now
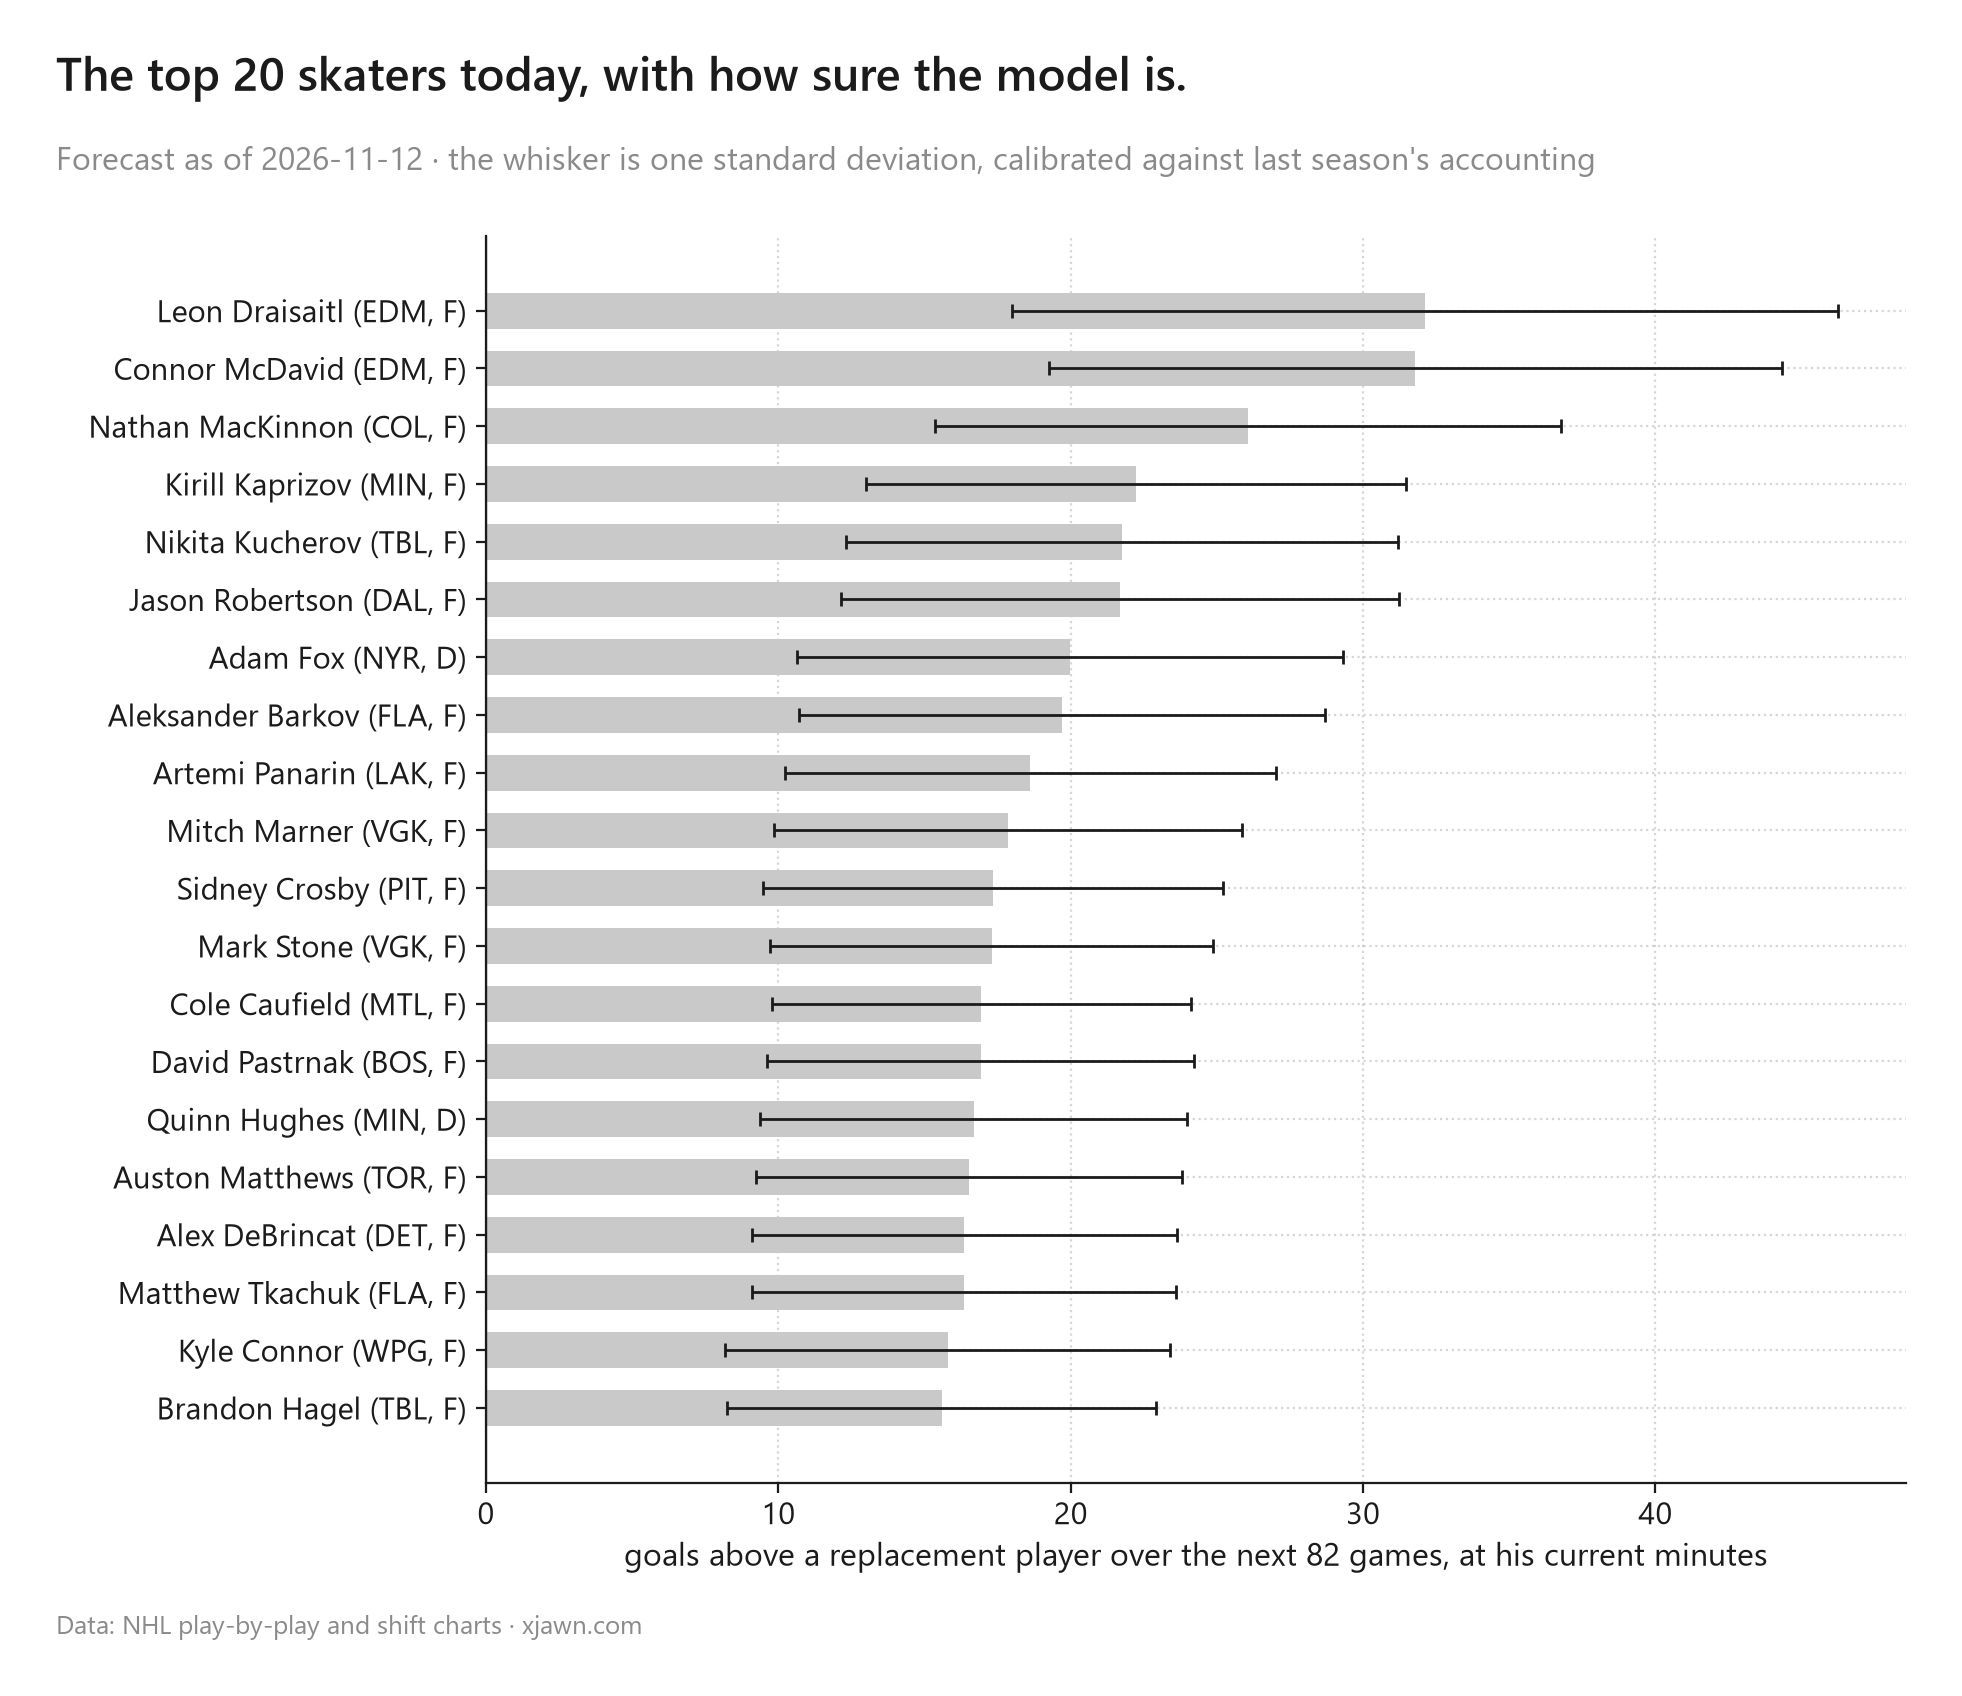
Read the whiskers. The ordering at the top is real, but the gaps between neighbours mostly are not; Connor McDavid and Nathan MacKinnon are within each other's margins, and so is most of the list. That is what a forecast of 82 unplayed games should look like.
Random thoughts
- The levels are generous. The old ratings were shrunk toward average on purpose; the new ones are not, so a player's forecast in goals runs wider than his accounting did. Against last season's accounting the point forecasts come in at roughly half scale. The ranks and the gaps are the useful part; for a player, treat the goals as an upper bound.
- Zero is today's league. The underlying ratings are measured against a fifteen-year average, and the league has drifted (the penalty kill most of all). Everything on these pages is re-centred on this season's dressed rosters, so a league-average rating reads zero and the league's goals above average sum to zero.
- Blocking and penalties are in now. The first version left both out. The version that calls games here rates shot blocking, penalties drawn and penalties taken the same way, one game at a time, and all three go into every call. The forecast in goals on the player cards counts the penalties; blocking stays inside the defense rating there.
- Every number above is on seasons the ratings have seen. The settings were chosen on them. The honest test is this season, on games the model has not seen. It started calling them on October 21, and since November 14 it makes every call on this site. I will report what it did, including if it did worse.
- Coaches have a number but no ranking. The coach term explains slow, persistent gaps between teams, not streaks, and at its settings no coach is distinguishable from zero yet. It is shown on a team's page as part of the total and nowhere else.