xJawn NHL expected goals
Today's puzzle Remember Some Guys: name the skater from his career Play →

← Games

Save a card: Summary · Full card · Game flow · STL skaters · UTA skaters · STL lines · UTA lines · Matchups

St. Louis Blues at Utah Mammoth, 1–0

St. Louis Blues STL
1–0
Final / SO

Nov 12, 2026 · 2026-27 · regular season

Our pregame call: STL 53.1% ✓ · expected 3.16–2.94 · how it scored ↓

Utah Mammoth UTA
Adjusts with rink filters

Strength and score are read from STL's side, the same minutes at both ends: PP = STL power play · PK = UTA power play · Leading = STL ahead · ST = each club's own power play.

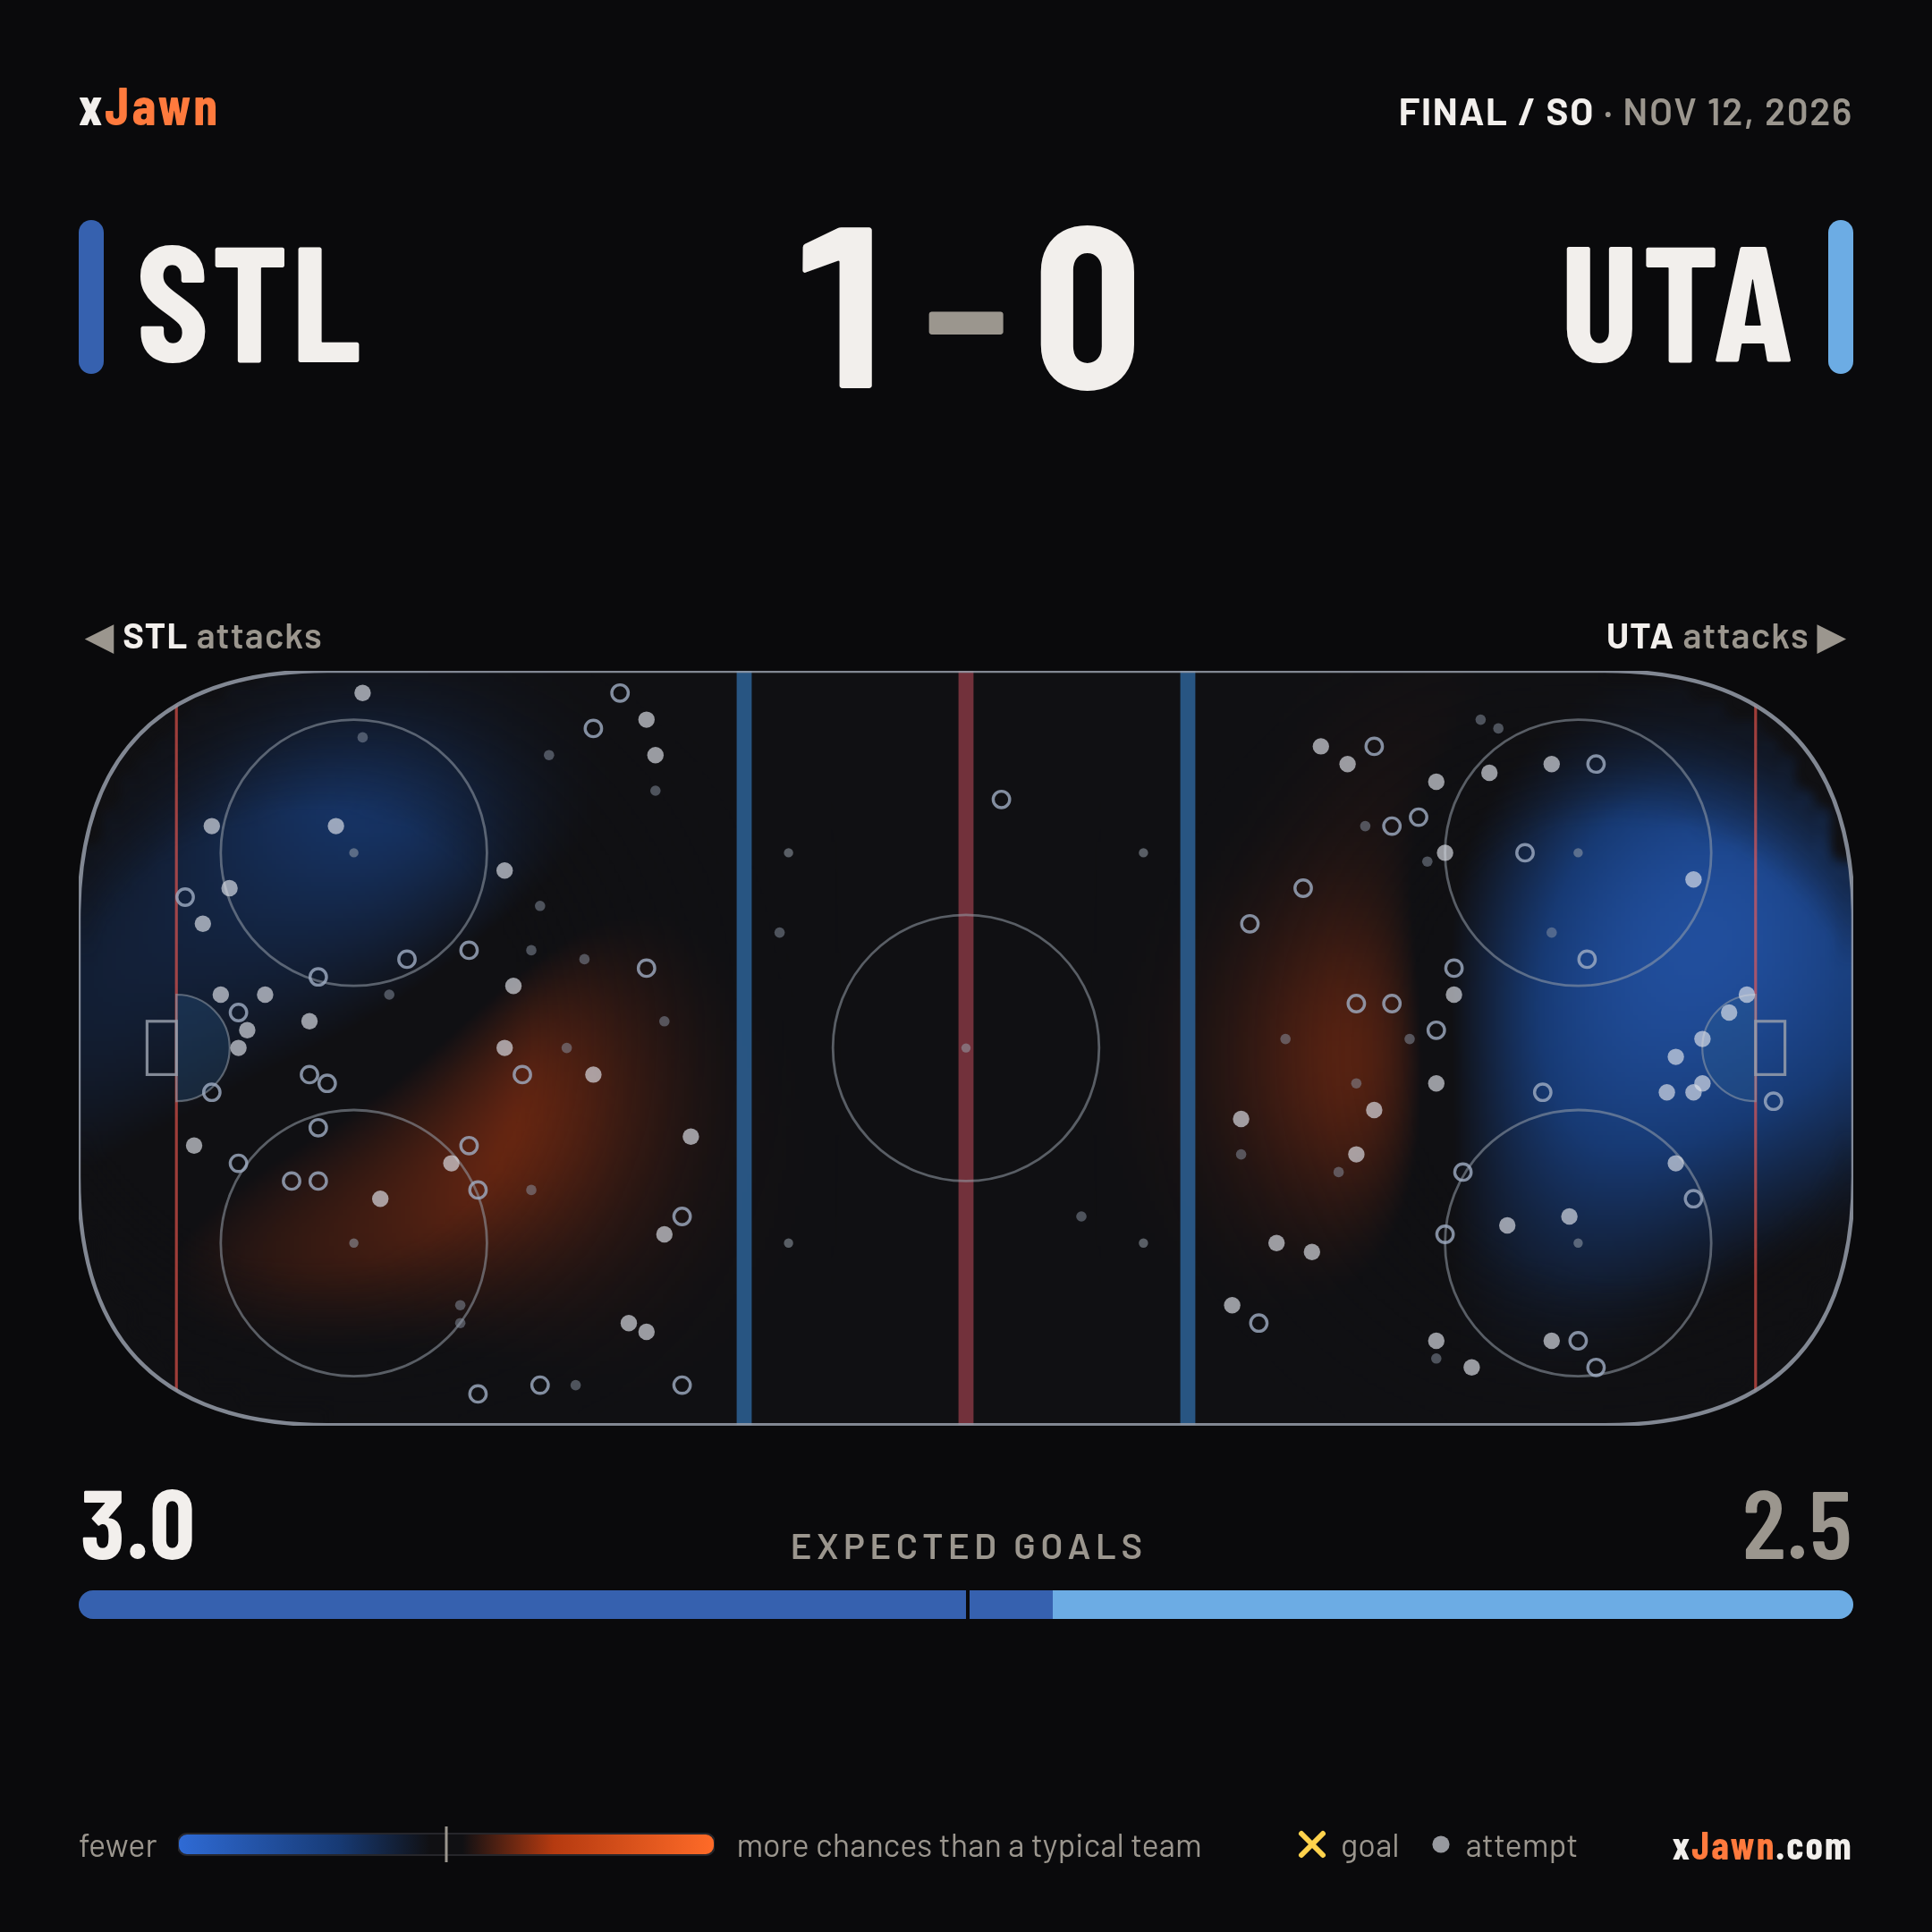
STL attacks◀ all strengths
UTA attacksall strengths ▶
× goal• on net ◦ missed· blocked Every shot attempt; the glow is where the dangerous chances came from. hover any attempt for the shooter, its xG and everything the model saw
How to read this map

One rink, both teams: STL attacks the left net, UTA the right. Every attempt is a Gaussian bump of height = its model xG. The controls switch the surface (xG heatmap ↔ vs league) and the markers; vs league compares this game against a typical NHL team-game under the same filter (2026-27 regular season, 358 games), so a 5v5 view is measured against league 5v5.

A strength or score filter is read from STL's side and mirrored for UTA: “STL PP” shows STL's power-play attempts on the left and UTA's shorthanded attempts on the right — the same minutes of the game at both ends. Empty-net attempts are excluded unless you include them. The Player control narrows the map and the rows beneath it to the attempts by either club while one player was on the ice (for a goalie, while he was in net); his own attempts wear a blue ring. vs league switches off while a player is picked — the league baseline is a whole team-game, which one player's slice is not. Hover any attempt for the shooter, the result, its xG, and the inputs behind it: clock, strength, score, shot type, distance, angle, handedness, rush/rebound, what happened just before, and the goalie or the blocker.

What each side produced

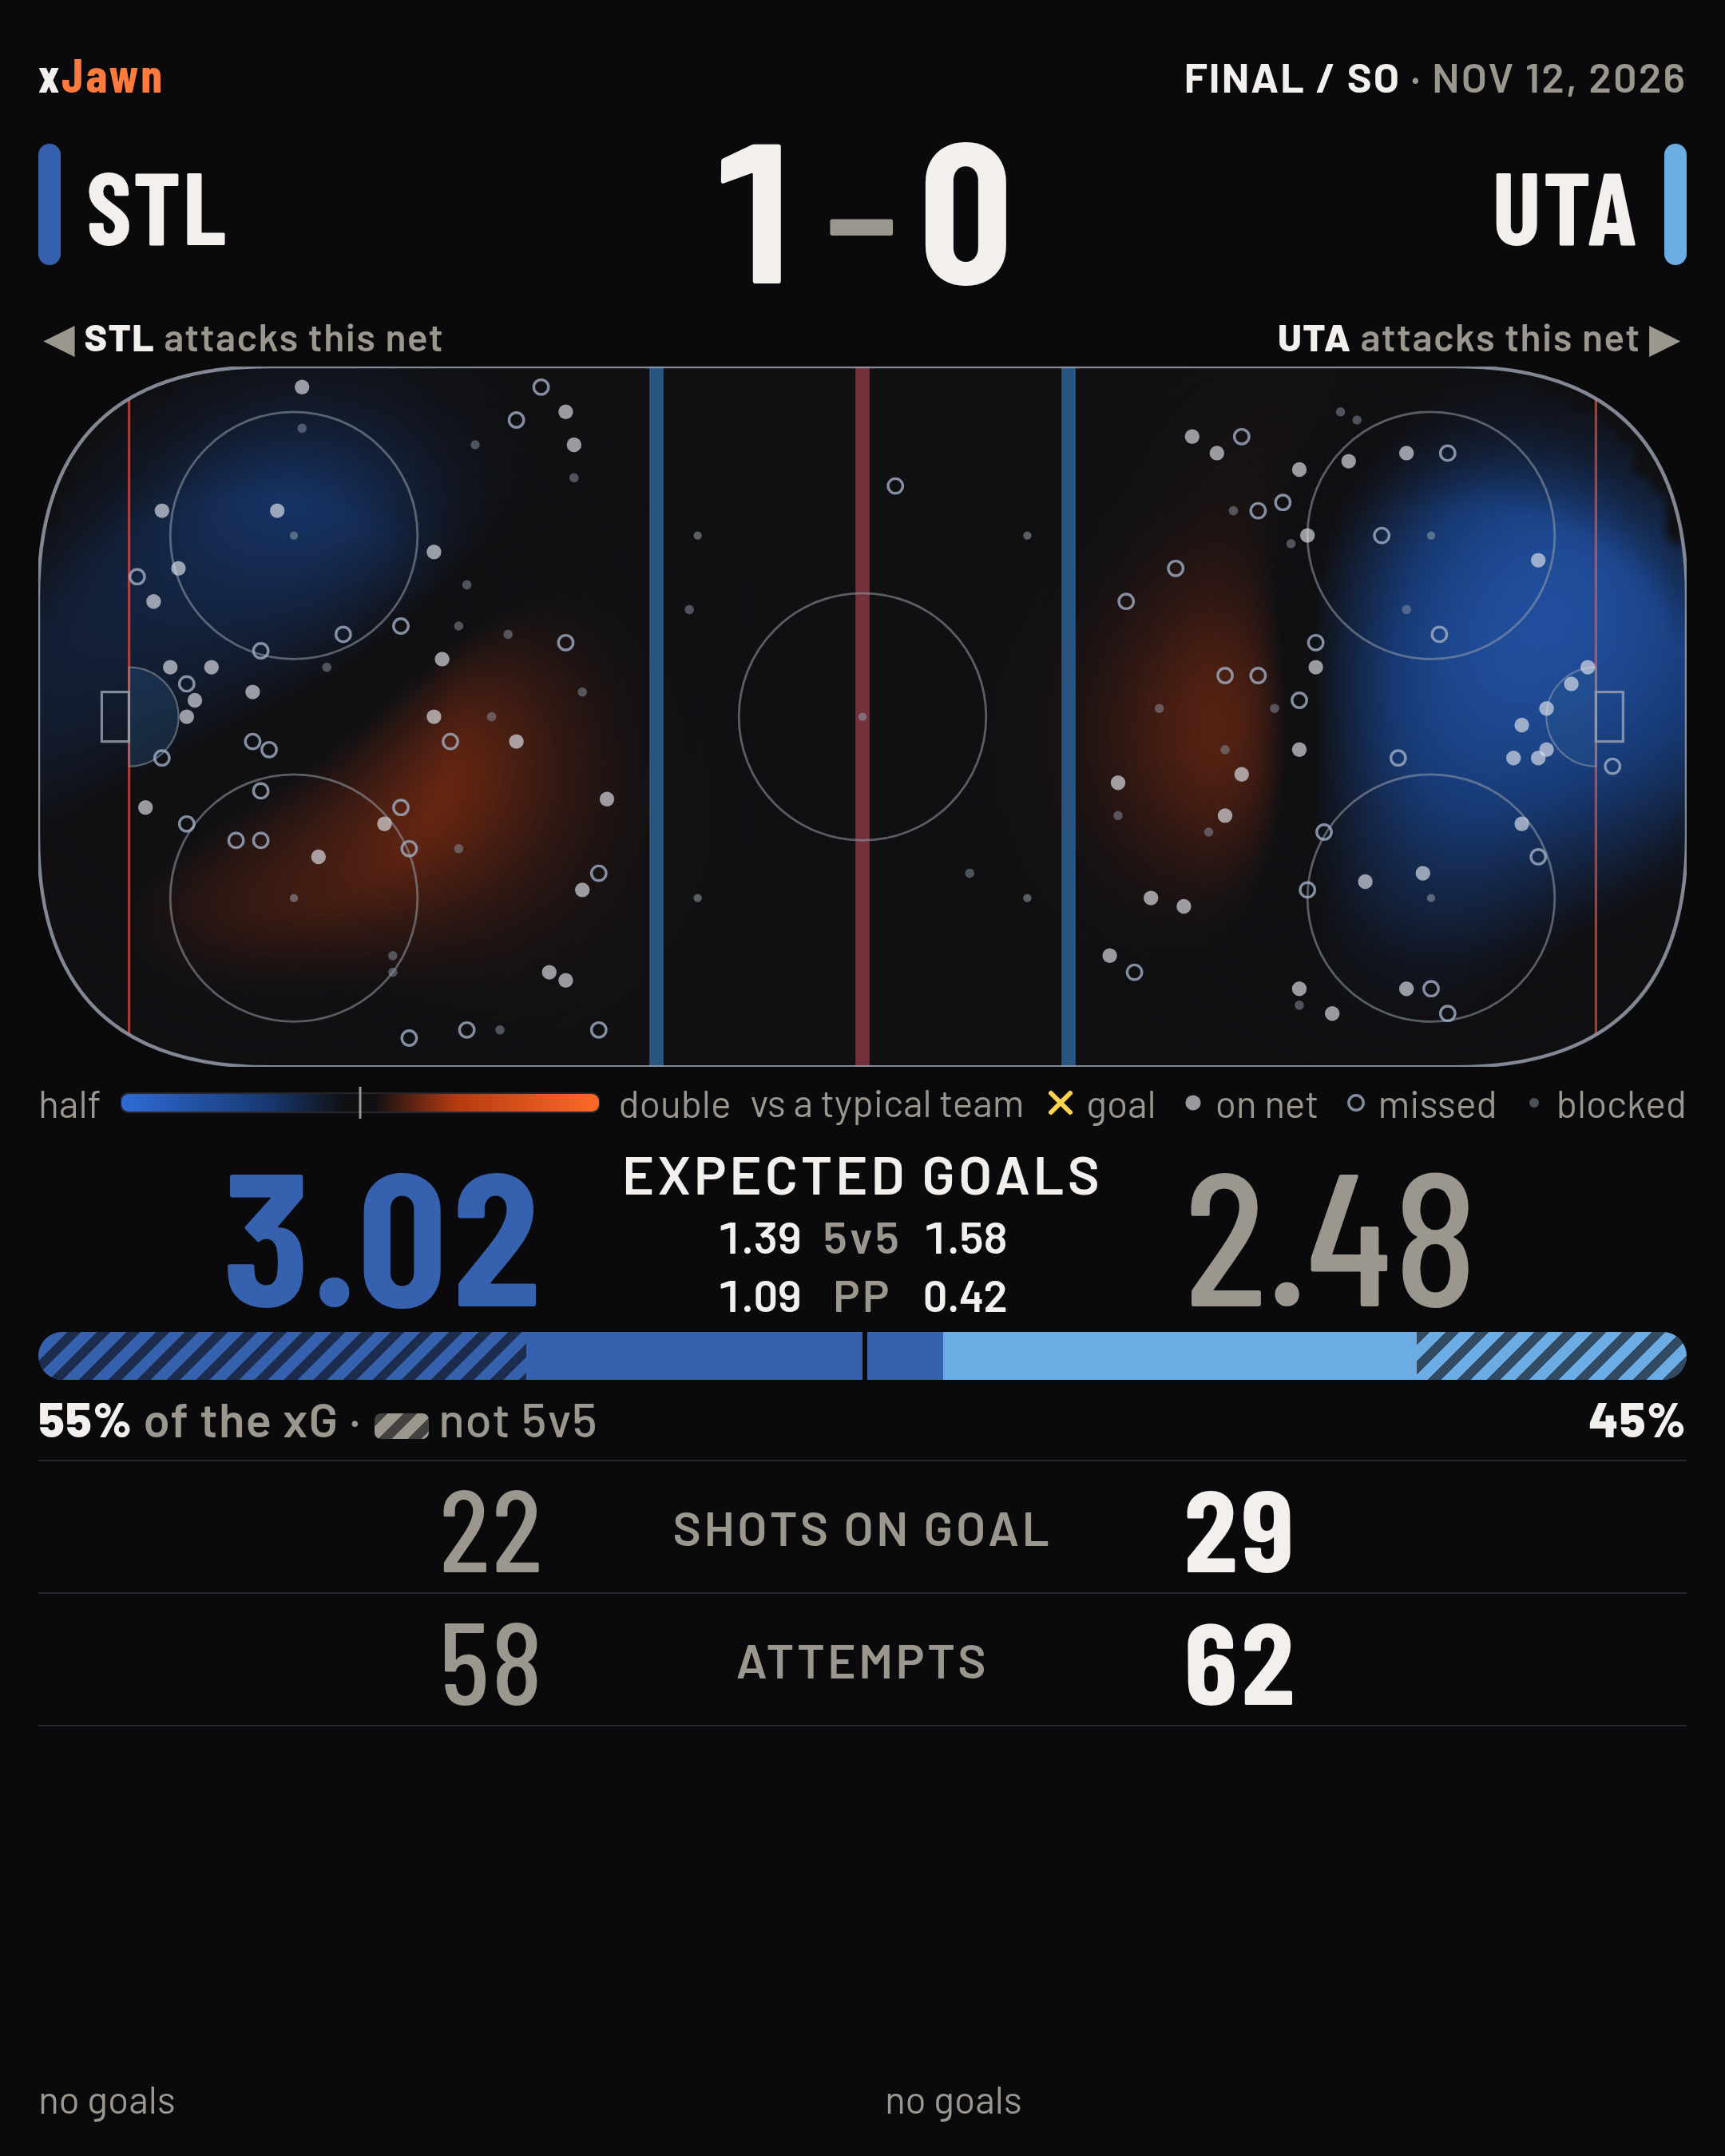
all strengths · this game
STL UTA
Each team's totals side by side; the longer bar led that row.
Goalson the map
0 0
Expected goals
3.02 2.48
xG%share of xG
55% 45%
High-dangerattempts ≥ 0.20 xG
0 0
Shots on goal
22 29
Attempts
58 62
xG by period · whole game 1st0.3–0.82nd1.3–0.93rd0.9–0.5OT0.5–0.2

The Blues beat the Mammoth 1–0 in a shootout on the road in a game the chances called about even, STL 3.0 to UTA 2.5 in expected goals. The Blues power play made 1.1 xG on 12 attempts.

Counts come from the shot table behind the map: empty-net attempts and the shootout are excluded, so the goals here can trail the official final by an empty-netter or the shootout's deciding goal. Same numbers as the post-game cards.

As the game went

all situations · this game
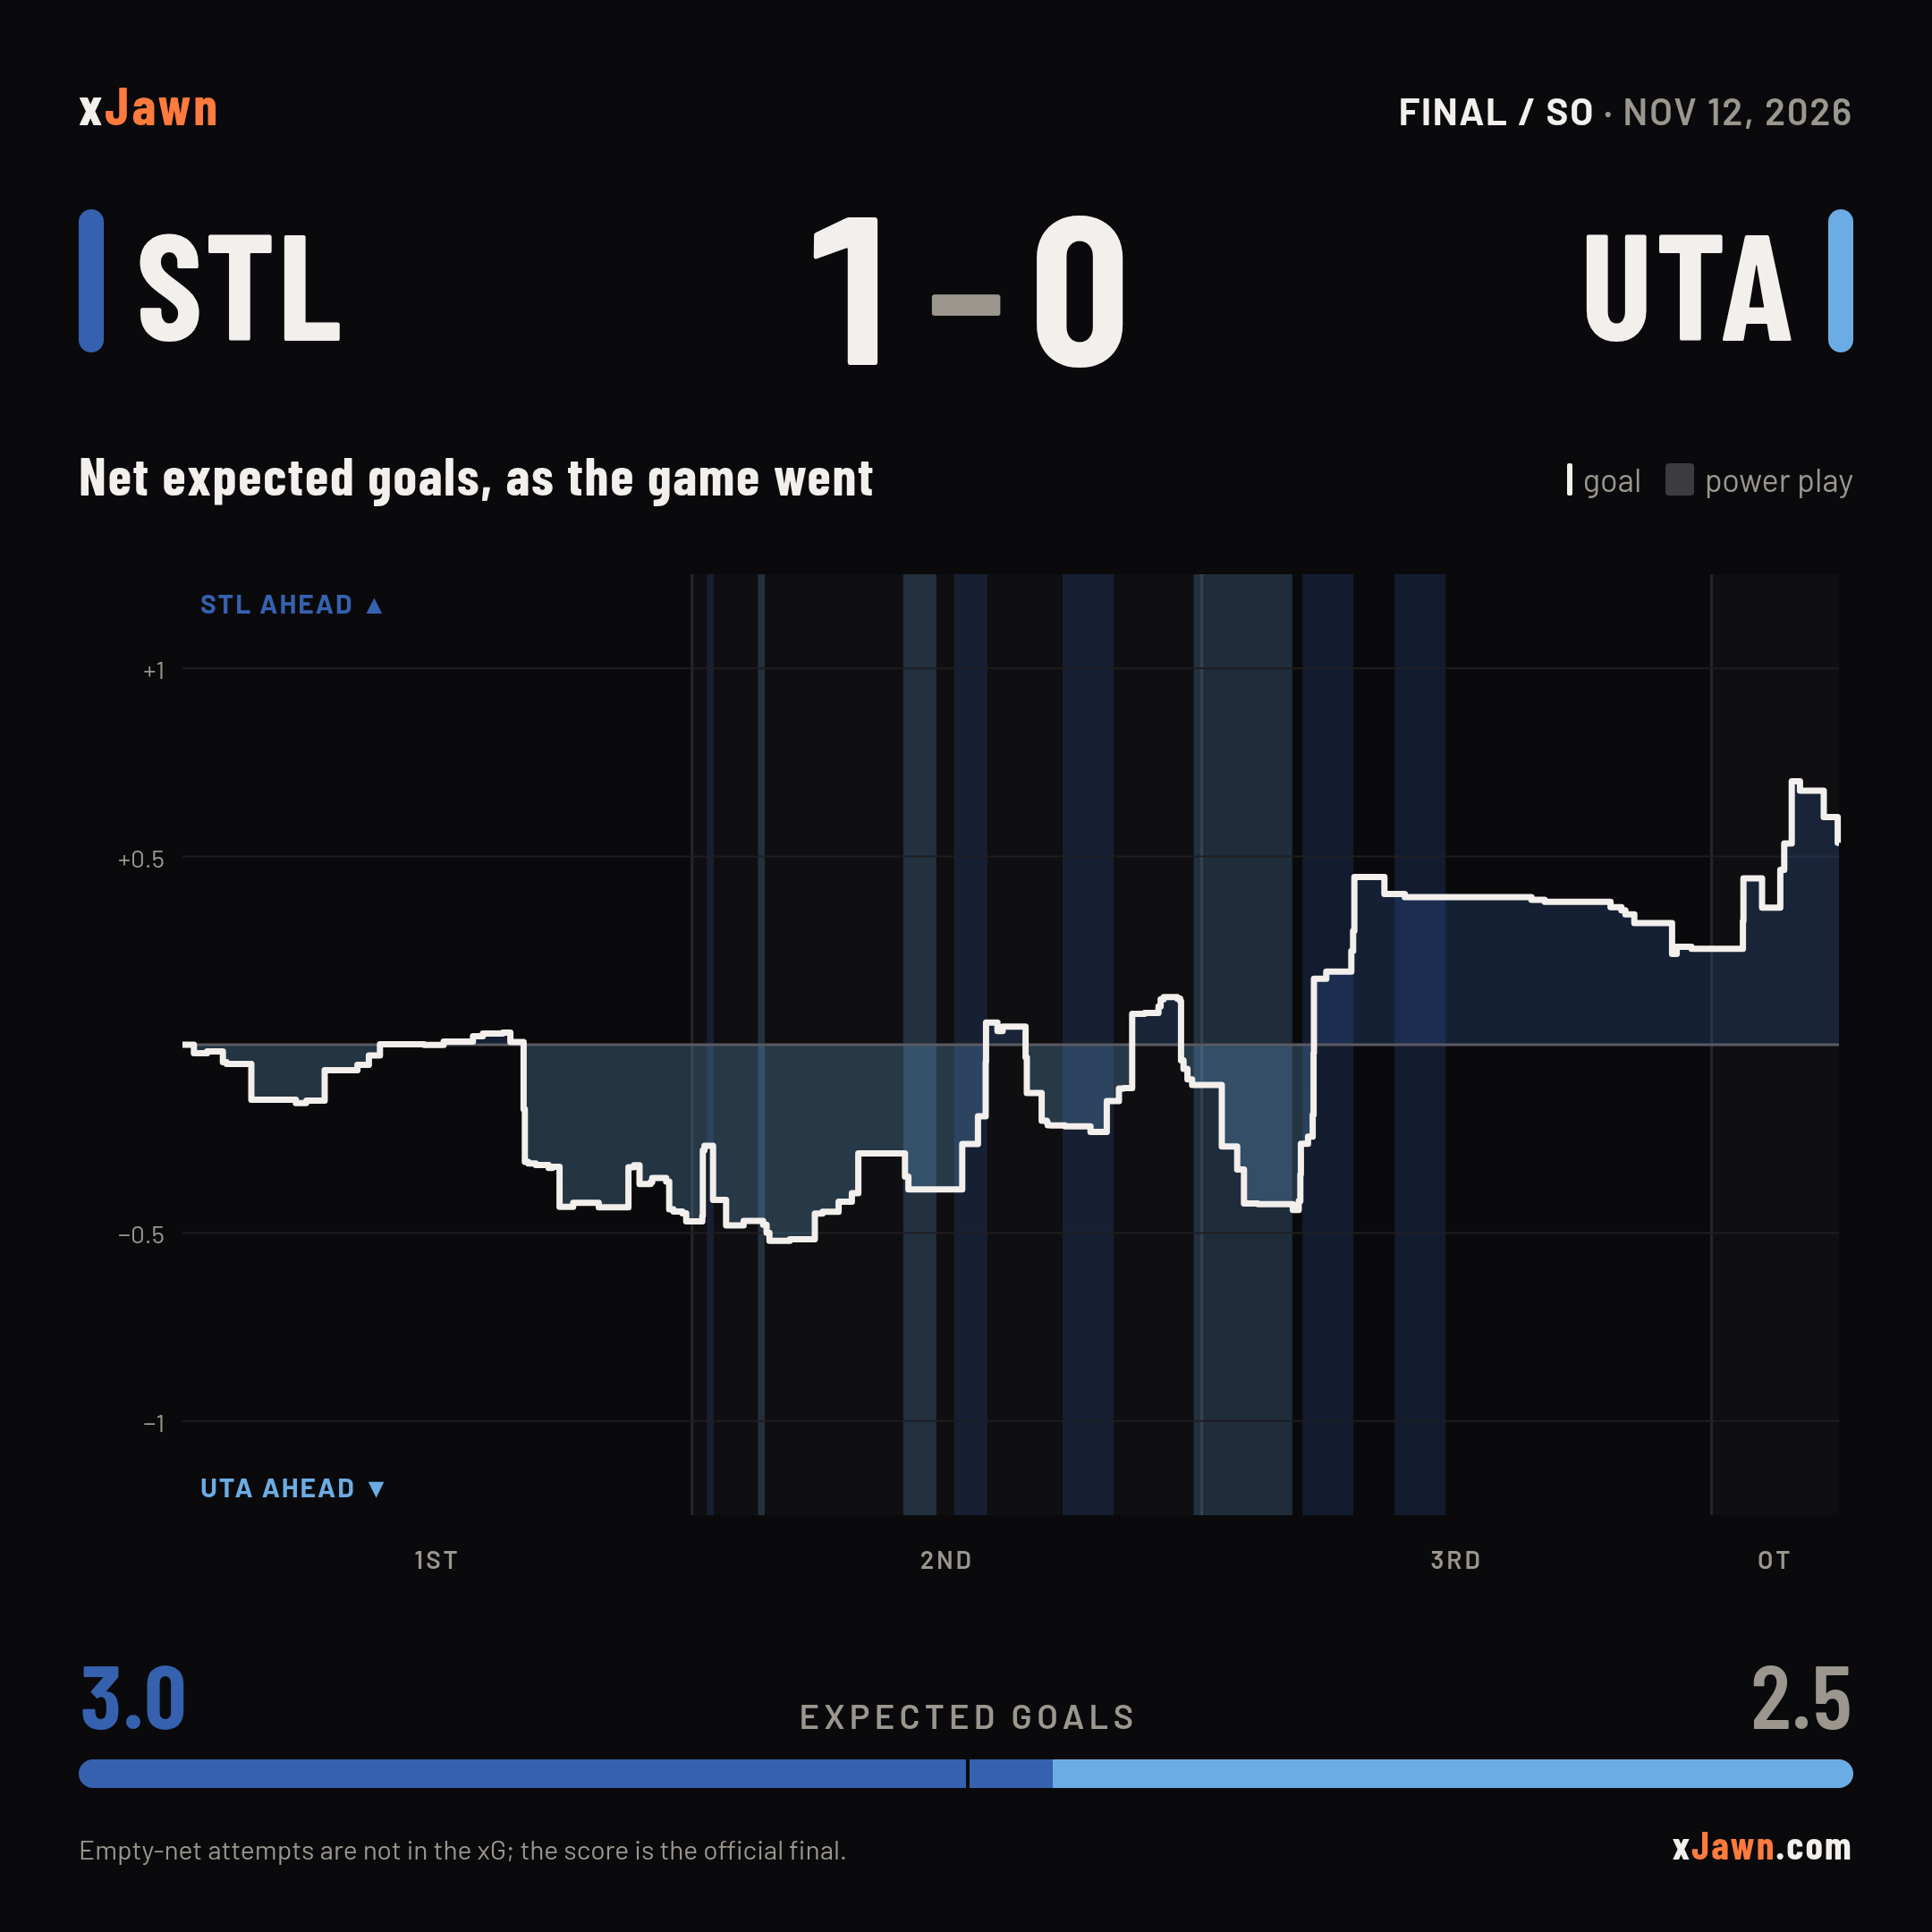
The running xG gap: above the line STL had the better chances, below it UTA; shaded bands are power plays.
1ST2ND3RDOT+0.5−0.5+1−1STL AHEAD ▲UTA AHEAD ▼
How to read this

One line: cumulative STL minus UTA expected goals. Above zero STL is ahead on chances, below zero UTA is. Shaded bands are power plays in the side's colour; vertical lines are goals.

Who

Skaters

all · whole game · this game
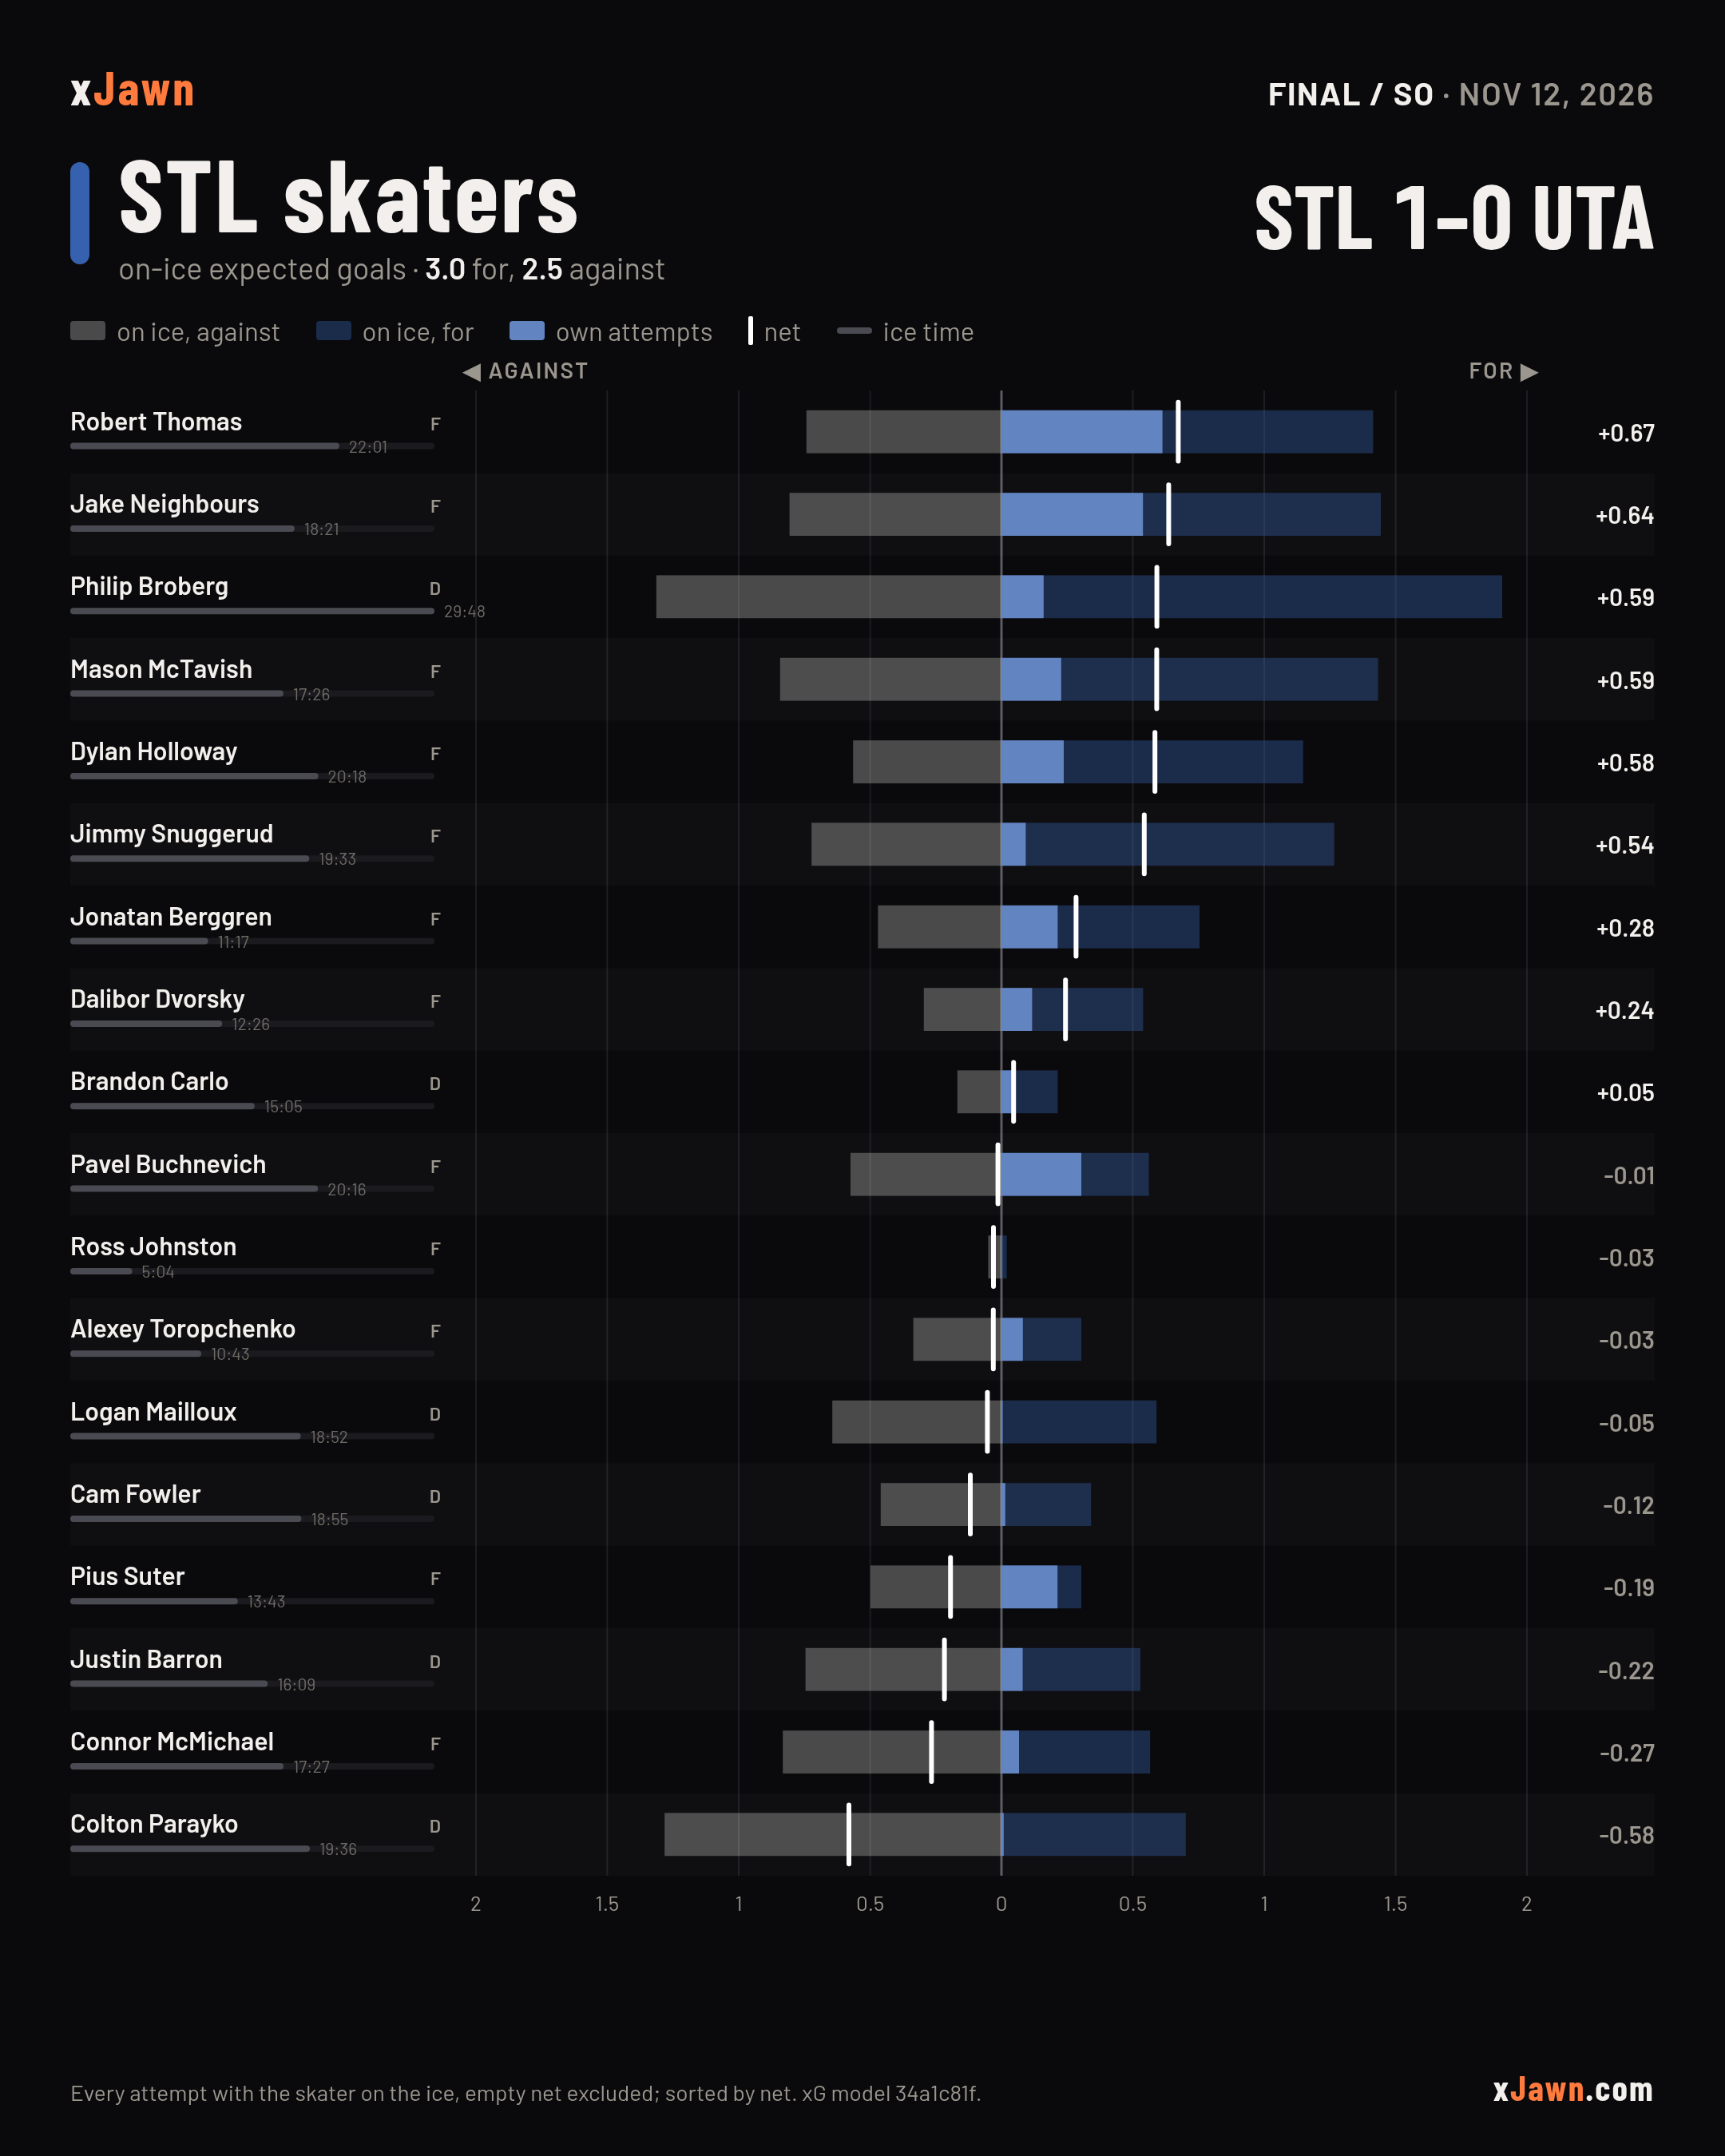
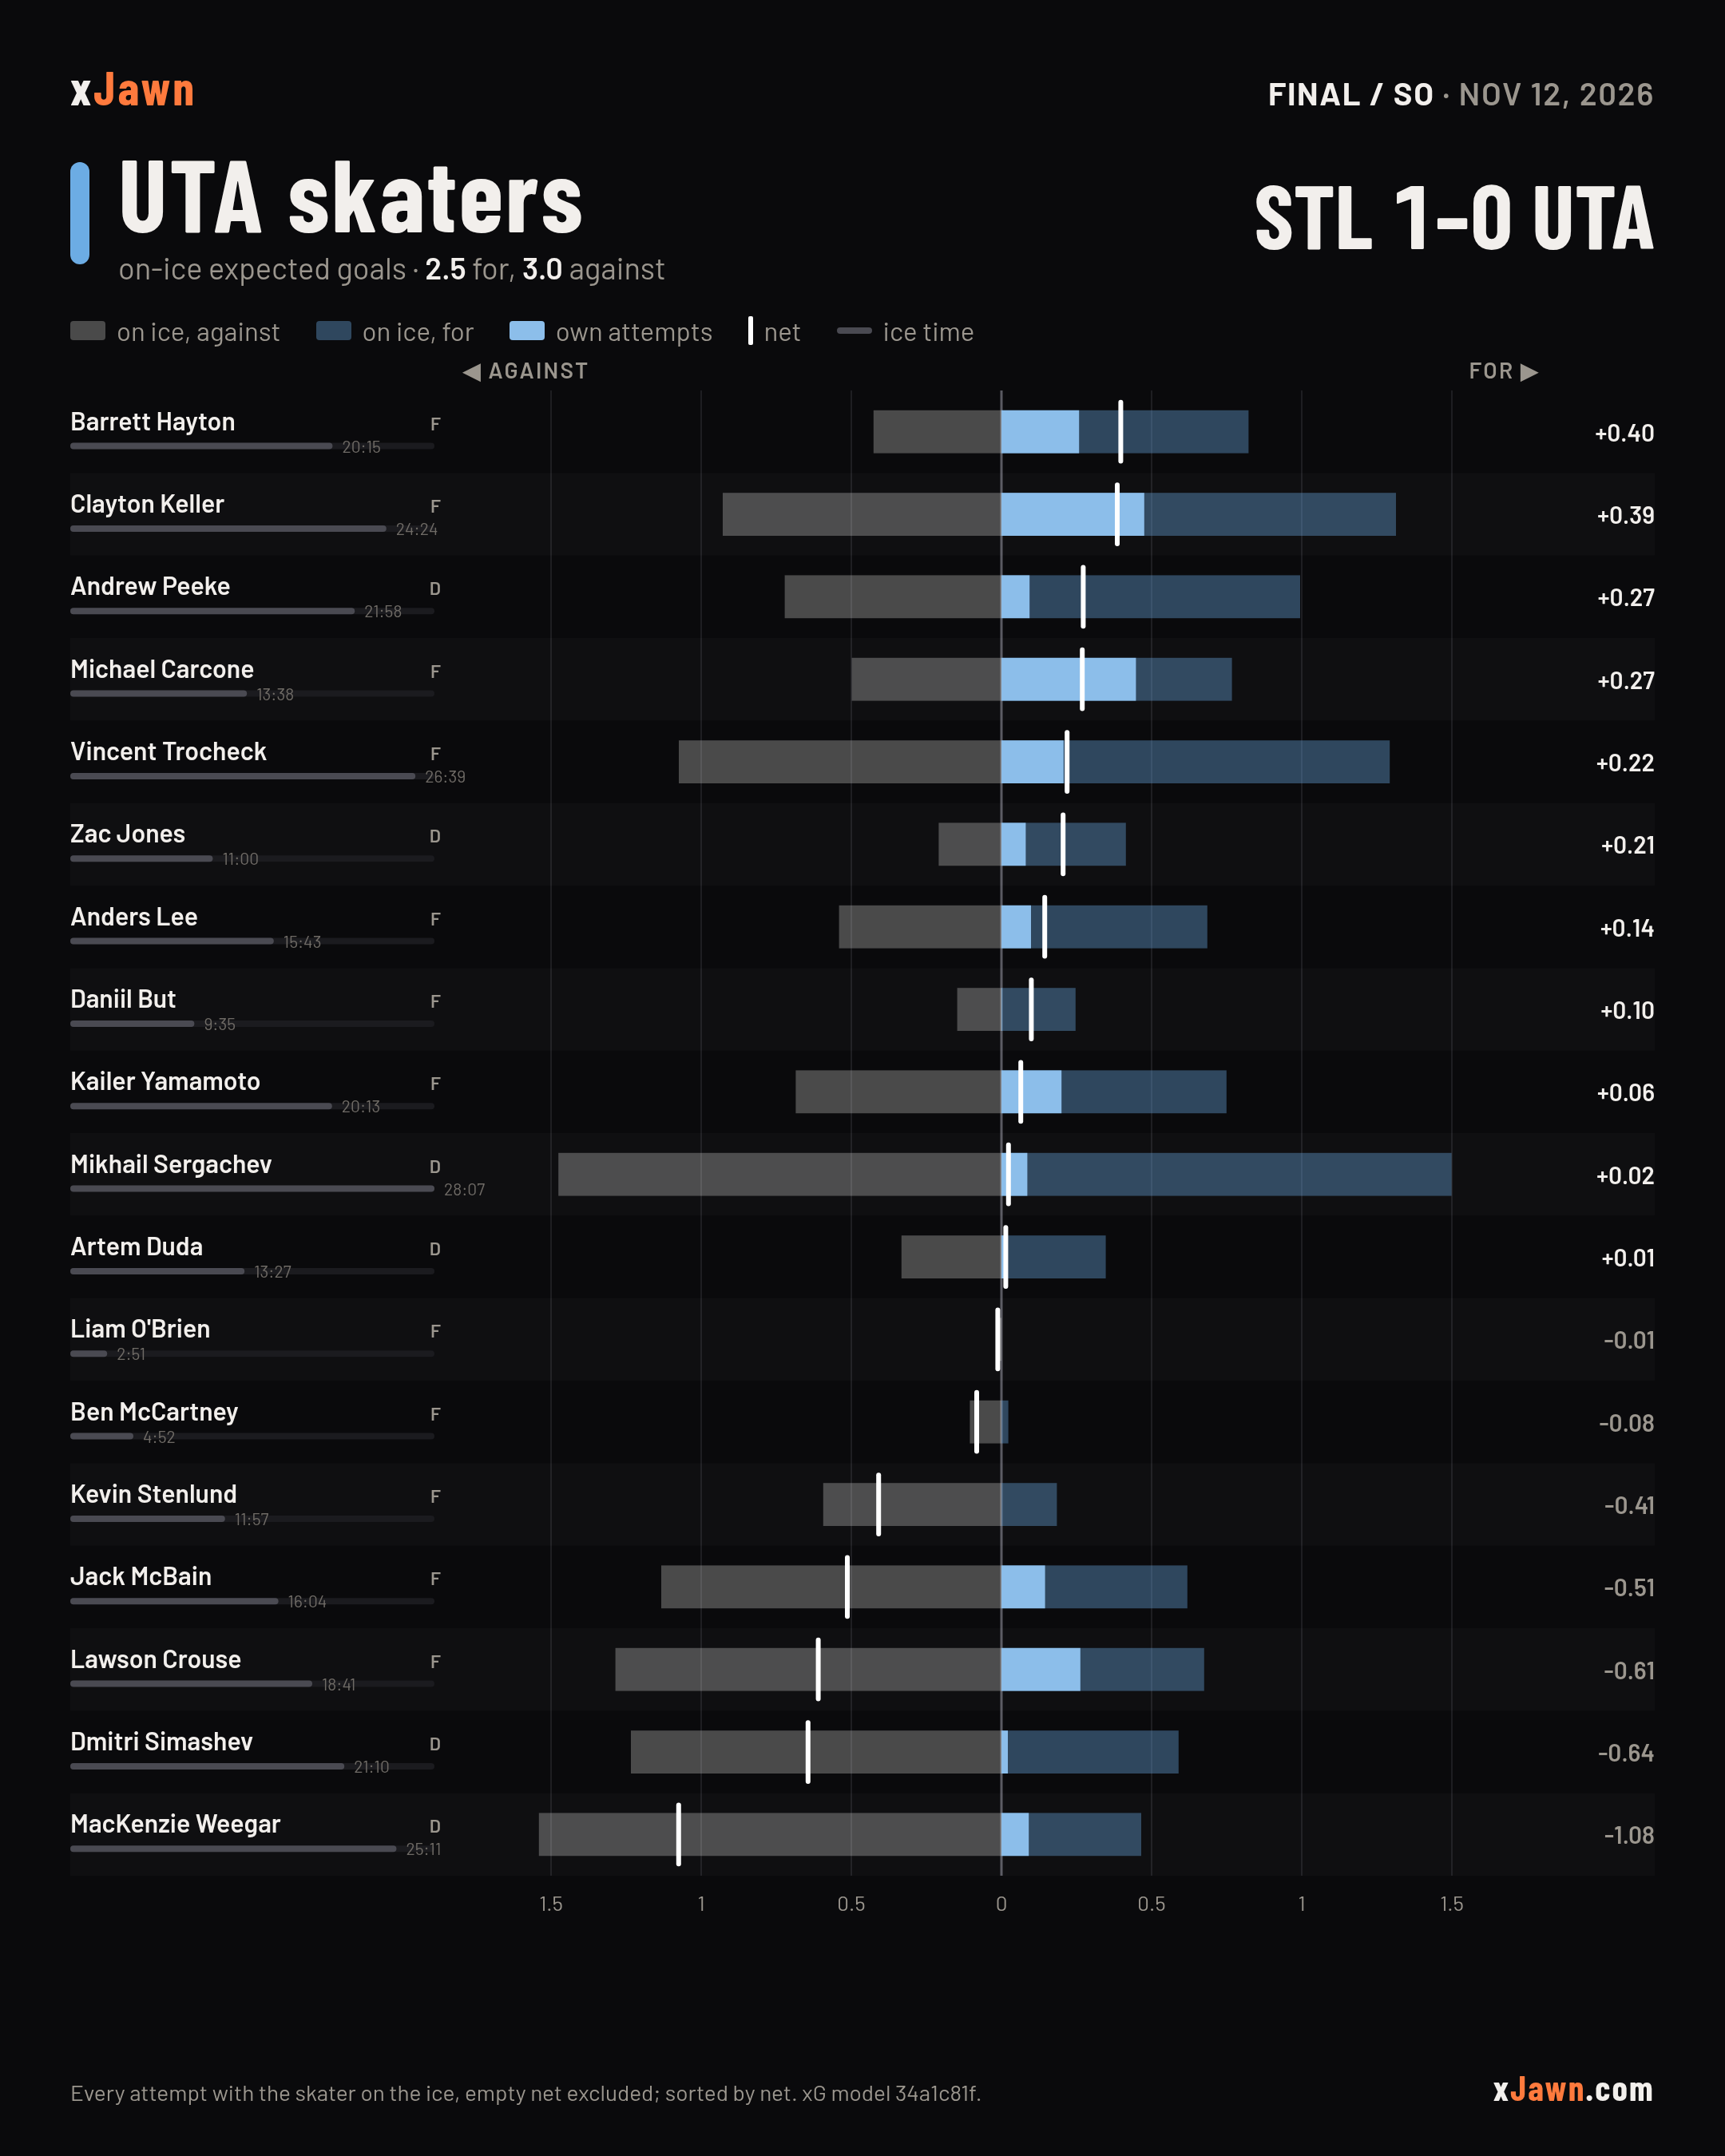
Team xG for (right) and against (left) with each skater on the ice; the solid bar is his own shots. Each skater against a league-average skater in the same minutes; right of zero is better.

vs expected is the whole game: the league rates are per state, not per period.

How to read this

Every skater: on-ice xG against to the left of zero, for to the right, his own attempts as the solid bar, a hash at the net. The slim track under the name is ice time. The chart opens sorted by net, best first; pick another key to re-order it, and click the same key again to flip it. A name opens the player's page. Pick a period and every bar re-lays for that period alone on the same scale as the whole game, so the three periods add up to it; a skater who did not play in it fades to the bottom. The Column switch puts on-ice xGF% on the right instead of net xG: the share of the xG with him on the ice that was his team's, xGF / (xGF + xGA).

On all strengths each bar is split by where its xG came from: plain is 5v5, striped is the power play, dotted is the penalty kill, and the lined piece beyond them is other: 4v4, 3v3 and penalty shots. A goalie pulled for an extra attacker counts as a power play for the side with the extra man.

vs expected holds every skater to a league-average skater in the same minutes: at 5v5, on the power play and on the kill, his on-ice xG for minus what the league produces in that time, and what the league allows minus his xG against. Every piece is good to the right of zero, so a penalty killer who was on for less than a kill usually allows sits right of zero however much he allowed. Orange is 5v5 offense and white is 5v5 defense; the power play (light orange) and the kill (grey) are each one net piece, chances for and against together, as on the player ratings. The league rates are this season's; 4v4 and 3v3 time is left out. One game is a small sample: this is what happened, not a rating.

STL
against for own net ice time power play penalty kill other 5v5 offense · defense power play · kill
0.50.5111.51.5220Robert ThomasF22:01power play: 0.90 xG forother (4v4, 3v3, penalty shots): 0.34 xG forpower play: 0.16 xG againstpenalty kill: 0.00 xG againstother (4v4, 3v3, penalty shots): 0.07 xG against+0.6765.6%Jake NeighboursF18:21power play: 0.90 xG forpower play: 0.15 xG against+0.6464.1%Philip BrobergD29:48power play: 0.90 xG forother (4v4, 3v3, penalty shots): 0.52 xG forpower play: 0.16 xG againstpenalty kill: 0.35 xG againstother (4v4, 3v3, penalty shots): 0.02 xG against+0.5959.2%Mason McTavishF17:26power play: 0.90 xG forpower play: 0.16 xG againstother (4v4, 3v3, penalty shots): 0.08 xG against+0.5963.0%Dylan HollowayF20:18power play: 0.19 xG forother (4v4, 3v3, penalty shots): 0.52 xG forpower play: 0.02 xG againstother (4v4, 3v3, penalty shots): 0.09 xG against+0.5867.0%Jimmy SnuggerudF19:33power play: 0.90 xG forother (4v4, 3v3, penalty shots): 0.19 xG forpower play: 0.16 xG againstother (4v4, 3v3, penalty shots): 0.16 xG against+0.5463.7%Jonatan BerggrenF11:17+0.2861.6%Dalibor DvorskyF12:26power play: 0.19 xG forpower play: 0.01 xG against+0.2464.6%Brandon CarloD15:05penalty kill: 0.07 xG against+0.0556.0%Pavel BuchnevichF20:16power play: 0.19 xG forother (4v4, 3v3, penalty shots): 0.01 xG forpower play: 0.01 xG againstpenalty kill: 0.06 xG againstother (4v4, 3v3, penalty shots): 0.14 xG against-0.0149.4%Ross JohnstonF5:04-0.0328.5%Alexey ToropchenkoF10:43penalty kill: 0.26 xG against-0.0347.6%Logan MaillouxD18:52power play: 0.11 xG forother (4v4, 3v3, penalty shots): 0.01 xG forpower play: 0.01 xG againstpenalty kill: 0.01 xG against-0.0547.8%Cam FowlerD18:55power play: 0.08 xG forother (4v4, 3v3, penalty shots): 0.07 xG against-0.1242.6%Pius SuterF13:43penalty kill: 0.36 xG against-0.1937.9%Justin BarronD16:09other (4v4, 3v3, penalty shots): 0.01 xG forpenalty kill: 0.06 xG againstother (4v4, 3v3, penalty shots): 0.14 xG against-0.2241.5%Connor McMichaelF17:27power play: 0.19 xG forother (4v4, 3v3, penalty shots): 0.01 xG forpower play: 0.01 xG againstpenalty kill: 0.07 xG againstother (4v4, 3v3, penalty shots): 0.08 xG against-0.2740.5%Colton ParaykoD19:36penalty kill: 0.35 xG againstother (4v4, 3v3, penalty shots): 0.15 xG against-0.5835.4%
+0.25−0.25+0.5−0.5+0.75−0.750Brandon CarloD14:395v5 offense: 0.21 xG for vs 0.50 expected (-0.29) in 12:175v5 defense: 0.10 xG against vs 0.50 expected (+0.41) in 12:17penalty kill: 0.00 xG for vs 0.03 expected, 0.07 against vs 0.31 expected (+0.21) in 2:22+0.33Jonatan BerggrenF11:175v5 offense: 0.75 xG for vs 0.46 expected (+0.29) in 11:175v5 defense: 0.47 xG against vs 0.46 expected (-0.01) in 11:17+0.28Alexey ToropchenkoF10:435v5 offense: 0.30 xG for vs 0.34 expected (-0.04) in 8:175v5 defense: 0.07 xG against vs 0.34 expected (+0.27) in 8:17penalty kill: 0.00 xG for vs 0.03 expected, 0.26 against vs 0.32 expected (+0.03) in 2:26+0.26Pius SuterF13:375v5 offense: 0.30 xG for vs 0.44 expected (-0.14) in 10:475v5 defense: 0.14 xG against vs 0.44 expected (+0.30) in 10:47penalty kill: 0.00 xG for vs 0.04 expected, 0.36 against vs 0.38 expected (-0.02) in 2:50+0.14Jake NeighboursF18:215v5 offense: 0.54 xG for vs 0.58 expected (-0.04) in 14:05power play: 0.90 xG for vs 0.57 expected, 0.15 against vs 0.06 expected (+0.24) in 4:165v5 defense: 0.66 xG against vs 0.58 expected (-0.08) in 14:05+0.12Pavel BuchnevichF17:505v5 offense: 0.36 xG for vs 0.53 expected (-0.17) in 13:01power play: 0.19 xG for vs 0.34 expected, 0.01 against vs 0.03 expected (-0.12) in 2:305v5 defense: 0.37 xG against vs 0.53 expected (+0.17) in 13:01penalty kill: 0.00 xG for vs 0.03 expected, 0.06 against vs 0.31 expected (+0.22) in 2:19+0.09Cam FowlerD17:335v5 offense: 0.26 xG for vs 0.61 expected (-0.35) in 14:58power play: 0.08 xG for vs 0.12 expected, 0.00 against vs 0.01 expected (-0.03) in 0:545v5 defense: 0.39 xG against vs 0.61 expected (+0.22) in 14:58penalty kill: 0.00 xG for vs 0.02 expected, 0.00 against vs 0.22 expected (+0.20) in 1:41+0.04Mason McTavishF16:125v5 offense: 0.53 xG for vs 0.45 expected (+0.08) in 10:56power play: 0.90 xG for vs 0.71 expected, 0.16 against vs 0.07 expected (+0.10) in 5:165v5 defense: 0.60 xG against vs 0.45 expected (-0.15) in 10:56+0.03Ross JohnstonF5:045v5 offense: 0.02 xG for vs 0.21 expected (-0.19) in 5:045v5 defense: 0.05 xG against vs 0.21 expected (+0.16) in 5:04-0.03Dalibor DvorskyF12:265v5 offense: 0.35 xG for vs 0.41 expected (-0.06) in 10:06power play: 0.19 xG for vs 0.31 expected, 0.01 against vs 0.03 expected (-0.10) in 2:205v5 defense: 0.29 xG against vs 0.41 expected (+0.13) in 10:06-0.04Justin BarronD14:035v5 offense: 0.52 xG for vs 0.54 expected (-0.02) in 13:02power play: 0.00 xG for vs 0.05 expected, 0.00 against vs 0.00 expected (-0.04) in 0:215v5 defense: 0.55 xG against vs 0.54 expected (-0.01) in 13:02penalty kill: 0.00 xG for vs 0.01 expected, 0.06 against vs 0.09 expected (+0.02) in 0:40-0.05Robert ThomasF19:535v5 offense: 0.18 xG for vs 0.53 expected (-0.35) in 12:51power play: 0.90 xG for vs 0.73 expected, 0.16 against vs 0.08 expected (+0.08) in 5:275v5 defense: 0.51 xG against vs 0.53 expected (+0.02) in 12:51penalty kill: 0.00 xG for vs 0.02 expected, 0.00 against vs 0.21 expected (+0.19) in 1:35-0.06Colton ParaykoD17:215v5 offense: 0.70 xG for vs 0.59 expected (+0.11) in 14:175v5 defense: 0.78 xG against vs 0.59 expected (-0.20) in 14:17penalty kill: 0.00 xG for vs 0.04 expected, 0.35 against vs 0.41 expected (+0.01) in 3:04-0.07Jimmy SnuggerudF17:035v5 offense: 0.18 xG for vs 0.50 expected (-0.32) in 12:09power play: 0.90 xG for vs 0.66 expected, 0.16 against vs 0.07 expected (+0.15) in 4:545v5 defense: 0.40 xG against vs 0.50 expected (+0.10) in 12:09-0.07Philip BrobergD27:095v5 offense: 0.48 xG for vs 0.78 expected (-0.30) in 19:01power play: 0.90 xG for vs 0.68 expected, 0.16 against vs 0.07 expected (+0.13) in 5:055v5 defense: 0.78 xG against vs 0.78 expected (+0.00) in 19:01penalty kill: 0.00 xG for vs 0.04 expected, 0.35 against vs 0.41 expected (+0.01) in 3:03-0.16Dylan HollowayF16:235v5 offense: 0.44 xG for vs 0.55 expected (-0.12) in 13:25power play: 0.19 xG for vs 0.40 expected, 0.02 against vs 0.04 expected (-0.19) in 2:585v5 defense: 0.45 xG against vs 0.55 expected (+0.10) in 13:25-0.20Logan MaillouxD17:485v5 offense: 0.47 xG for vs 0.65 expected (-0.18) in 15:50power play: 0.11 xG for vs 0.23 expected, 0.01 against vs 0.02 expected (-0.11) in 1:425v5 defense: 0.63 xG against vs 0.65 expected (+0.02) in 15:50penalty kill: 0.00 xG for vs 0.00 expected, 0.01 against vs 0.04 expected (+0.02) in 0:16-0.24Connor McMichaelF14:545v5 offense: 0.36 xG for vs 0.47 expected (-0.11) in 11:27power play: 0.19 xG for vs 0.28 expected, 0.01 against vs 0.03 expected (-0.07) in 2:075v5 defense: 0.67 xG against vs 0.47 expected (-0.20) in 11:27penalty kill: 0.00 xG for vs 0.02 expected, 0.07 against vs 0.18 expected (+0.09) in 1:20-0.30
0.250.250.50.50.750.75110Jonatan BerggrenF11:17+0.2861.6%Alexey ToropchenkoF8:17+0.2380.4%Pius SuterF10:47+0.1768.7%Brandon CarloD12:17+0.1268.8%Dalibor DvorskyF10:06+0.0654.9%Pavel BuchnevichF13:01-0.0149.5%Dylan HollowayF13:25-0.0149.2%Justin BarronD13:02-0.0348.6%Ross JohnstonF5:04-0.0328.5%Mason McTavishF10:56-0.0746.8%Colton ParaykoD14:17-0.0847.2%Jake NeighboursF14:05-0.1245.1%Cam FowlerD14:58-0.1339.8%Logan MaillouxD15:50-0.1642.9%Jimmy SnuggerudF12:09-0.2230.8%Philip BrobergD19:01-0.3038.2%Connor McMichaelF11:27-0.3135.1%Robert ThomasF12:51-0.3325.8%
+0.25−0.25+0.5−0.50Jonatan BerggrenF11:175v5 offense: 0.75 xG for vs 0.46 expected (+0.29) in 11:175v5 defense: 0.47 xG against vs 0.46 expected (-0.01) in 11:17+0.28Alexey ToropchenkoF8:175v5 offense: 0.30 xG for vs 0.34 expected (-0.04) in 8:175v5 defense: 0.07 xG against vs 0.34 expected (+0.27) in 8:17+0.23Pius SuterF10:475v5 offense: 0.30 xG for vs 0.44 expected (-0.14) in 10:475v5 defense: 0.14 xG against vs 0.44 expected (+0.30) in 10:47+0.17Brandon CarloD12:175v5 offense: 0.21 xG for vs 0.50 expected (-0.29) in 12:175v5 defense: 0.10 xG against vs 0.50 expected (+0.41) in 12:17+0.12Dalibor DvorskyF10:065v5 offense: 0.35 xG for vs 0.41 expected (-0.06) in 10:065v5 defense: 0.29 xG against vs 0.41 expected (+0.13) in 10:06+0.06Pavel BuchnevichF13:015v5 offense: 0.36 xG for vs 0.53 expected (-0.17) in 13:015v5 defense: 0.37 xG against vs 0.53 expected (+0.17) in 13:01-0.01Dylan HollowayF13:255v5 offense: 0.44 xG for vs 0.55 expected (-0.12) in 13:255v5 defense: 0.45 xG against vs 0.55 expected (+0.10) in 13:25-0.01Justin BarronD13:025v5 offense: 0.52 xG for vs 0.54 expected (-0.02) in 13:025v5 defense: 0.55 xG against vs 0.54 expected (-0.01) in 13:02-0.03Ross JohnstonF5:045v5 offense: 0.02 xG for vs 0.21 expected (-0.19) in 5:045v5 defense: 0.05 xG against vs 0.21 expected (+0.16) in 5:04-0.03Mason McTavishF10:565v5 offense: 0.53 xG for vs 0.45 expected (+0.08) in 10:565v5 defense: 0.60 xG against vs 0.45 expected (-0.15) in 10:56-0.07Colton ParaykoD14:175v5 offense: 0.70 xG for vs 0.59 expected (+0.11) in 14:175v5 defense: 0.78 xG against vs 0.59 expected (-0.20) in 14:17-0.08Jake NeighboursF14:055v5 offense: 0.54 xG for vs 0.58 expected (-0.04) in 14:055v5 defense: 0.66 xG against vs 0.58 expected (-0.08) in 14:05-0.12Cam FowlerD14:585v5 offense: 0.26 xG for vs 0.61 expected (-0.35) in 14:585v5 defense: 0.39 xG against vs 0.61 expected (+0.22) in 14:58-0.13Logan MaillouxD15:505v5 offense: 0.47 xG for vs 0.65 expected (-0.18) in 15:505v5 defense: 0.63 xG against vs 0.65 expected (+0.02) in 15:50-0.16Jimmy SnuggerudF12:095v5 offense: 0.18 xG for vs 0.50 expected (-0.32) in 12:095v5 defense: 0.40 xG against vs 0.50 expected (+0.10) in 12:09-0.22Philip BrobergD19:015v5 offense: 0.48 xG for vs 0.78 expected (-0.30) in 19:015v5 defense: 0.78 xG against vs 0.78 expected (+0.00) in 19:01-0.30Connor McMichaelF11:275v5 offense: 0.36 xG for vs 0.47 expected (-0.11) in 11:275v5 defense: 0.67 xG against vs 0.47 expected (-0.20) in 11:27-0.31Robert ThomasF12:515v5 offense: 0.18 xG for vs 0.53 expected (-0.35) in 12:515v5 defense: 0.51 xG against vs 0.53 expected (+0.02) in 12:51-0.33
0.250.250.50.50.750.75110Jake NeighboursF4:16+0.7686.1%Robert ThomasF5:27+0.7484.9%Mason McTavishF5:16+0.7484.9%Philip BrobergD5:05+0.7484.9%Jimmy SnuggerudF4:54+0.7484.9%Pavel BuchnevichF2:30+0.1895.8%Dalibor DvorskyF2:20+0.1895.8%Connor McMichaelF2:07+0.1895.8%Dylan HollowayF2:58+0.1789.2%Logan MaillouxD1:42+0.1092.8%Cam FowlerD0:54+0.08100.0%Justin BarronD0:21+0.00—
+0.25−0.250Jake NeighboursF4:16power play: 0.90 xG for vs 0.57 expected, 0.15 against vs 0.06 expected (+0.24) in 4:16+0.24Jimmy SnuggerudF4:54power play: 0.90 xG for vs 0.66 expected, 0.16 against vs 0.07 expected (+0.15) in 4:54+0.15Philip BrobergD5:05power play: 0.90 xG for vs 0.68 expected, 0.16 against vs 0.07 expected (+0.13) in 5:05+0.13Mason McTavishF5:16power play: 0.90 xG for vs 0.71 expected, 0.16 against vs 0.07 expected (+0.10) in 5:16+0.10Robert ThomasF5:27power play: 0.90 xG for vs 0.73 expected, 0.16 against vs 0.08 expected (+0.08) in 5:27+0.08Cam FowlerD0:54power play: 0.08 xG for vs 0.12 expected, 0.00 against vs 0.01 expected (-0.03) in 0:54-0.03Justin BarronD0:21power play: 0.00 xG for vs 0.05 expected, 0.00 against vs 0.00 expected (-0.04) in 0:21-0.04Connor McMichaelF2:07power play: 0.19 xG for vs 0.28 expected, 0.01 against vs 0.03 expected (-0.07) in 2:07-0.07Dalibor DvorskyF2:20power play: 0.19 xG for vs 0.31 expected, 0.01 against vs 0.03 expected (-0.10) in 2:20-0.10Logan MaillouxD1:42power play: 0.11 xG for vs 0.23 expected, 0.01 against vs 0.02 expected (-0.11) in 1:42-0.11Pavel BuchnevichF2:30power play: 0.19 xG for vs 0.34 expected, 0.01 against vs 0.03 expected (-0.12) in 2:30-0.12Dylan HollowayF2:58power play: 0.19 xG for vs 0.40 expected, 0.02 against vs 0.04 expected (-0.19) in 2:58-0.19
0.250.250.50.50Cam FowlerD1:41+0.00—Robert ThomasF1:35-0.000.0%Logan MaillouxD0:16-0.010.0%Pavel BuchnevichF2:19-0.060.0%Justin BarronD0:40-0.060.0%Brandon CarloD2:22-0.070.0%Connor McMichaelF1:20-0.070.0%Alexey ToropchenkoF2:26-0.260.0%Colton ParaykoD3:04-0.350.0%Philip BrobergD3:03-0.350.0%Pius SuterF2:50-0.360.0%
+0.25−0.250Pavel BuchnevichF2:19penalty kill: 0.00 xG for vs 0.03 expected, 0.06 against vs 0.31 expected (+0.22) in 2:19+0.22Brandon CarloD2:22penalty kill: 0.00 xG for vs 0.03 expected, 0.07 against vs 0.31 expected (+0.21) in 2:22+0.21Cam FowlerD1:41penalty kill: 0.00 xG for vs 0.02 expected, 0.00 against vs 0.22 expected (+0.20) in 1:41+0.20Robert ThomasF1:35penalty kill: 0.00 xG for vs 0.02 expected, 0.00 against vs 0.21 expected (+0.19) in 1:35+0.19Connor McMichaelF1:20penalty kill: 0.00 xG for vs 0.02 expected, 0.07 against vs 0.18 expected (+0.09) in 1:20+0.09Alexey ToropchenkoF2:26penalty kill: 0.00 xG for vs 0.03 expected, 0.26 against vs 0.32 expected (+0.03) in 2:26+0.03Logan MaillouxD0:16penalty kill: 0.00 xG for vs 0.00 expected, 0.01 against vs 0.04 expected (+0.02) in 0:16+0.02Justin BarronD0:40penalty kill: 0.00 xG for vs 0.01 expected, 0.06 against vs 0.09 expected (+0.02) in 0:40+0.02Colton ParaykoD3:04penalty kill: 0.00 xG for vs 0.04 expected, 0.35 against vs 0.41 expected (+0.01) in 3:04+0.01Philip BrobergD3:03penalty kill: 0.00 xG for vs 0.04 expected, 0.35 against vs 0.41 expected (+0.01) in 3:03+0.01Pius SuterF2:50penalty kill: 0.00 xG for vs 0.04 expected, 0.36 against vs 0.38 expected (-0.02) in 2:50-0.02
UTA
against for own net ice time power play penalty kill other 5v5 offense · defense power play · kill
0.50.5111.51.50Barrett HaytonF20:15power play: 0.41 xG forpenalty kill: 0.01 xG forother (4v4, 3v3, penalty shots): 0.14 xG forpenalty kill: 0.02 xG againstother (4v4, 3v3, penalty shots): 0.25 xG against+0.4065.9%Clayton KellerF24:24power play: 0.41 xG forother (4v4, 3v3, penalty shots): 0.14 xG forother (4v4, 3v3, penalty shots): 0.10 xG against+0.3958.6%Andrew PeekeD21:58penalty kill: 0.01 xG forpenalty kill: 0.10 xG againstother (4v4, 3v3, penalty shots): 0.01 xG against+0.2757.9%Michael CarconeF13:38power play: 0.01 xG forother (4v4, 3v3, penalty shots): 0.10 xG forother (4v4, 3v3, penalty shots): 0.19 xG against+0.2760.6%Vincent TrocheckF26:39power play: 0.41 xG forpenalty kill: 0.01 xG forother (4v4, 3v3, penalty shots): 0.17 xG forpenalty kill: 0.34 xG againstother (4v4, 3v3, penalty shots): 0.19 xG against+0.2254.6%Zac JonesD11:00power play: 0.01 xG for+0.2166.4%Anders LeeF15:43power play: 0.01 xG for+0.1455.9%Daniil ButF9:35power play: 0.00 xG for+0.1062.6%Kailer YamamotoF20:13power play: 0.41 xG forother (4v4, 3v3, penalty shots): 0.07 xG forpenalty kill: 0.11 xG againstother (4v4, 3v3, penalty shots): 0.11 xG against+0.0652.2%Mikhail SergachevD28:07power play: 0.36 xG forpenalty kill: 0.03 xG forother (4v4, 3v3, penalty shots): 0.28 xG forpenalty kill: 0.34 xG againstother (4v4, 3v3, penalty shots): 0.34 xG against+0.0250.4%Artem DudaD13:27+0.0151.1%Liam O'BrienF2:51-0.010.0%Ben McCartneyF4:52-0.0817.8%Kevin StenlundF11:57penalty kill: 0.15 xG forpenalty kill: 0.12 xG against-0.4123.7%Jack McBainF16:04power play: 0.01 xG forpenalty kill: 0.00 xG forpenalty kill: 0.84 xG against-0.5135.3%Lawson CrouseF18:41power play: 0.00 xG forpenalty kill: 0.15 xG forpenalty kill: 0.75 xG againstother (4v4, 3v3, penalty shots): 0.23 xG against-0.6134.4%Dmitri SimashevD21:10penalty kill: 0.14 xG forpenalty kill: 0.75 xG againstother (4v4, 3v3, penalty shots): 0.01 xG against-0.6432.3%MacKenzie WeegarD25:11power play: 0.06 xG forpenalty kill: 0.15 xG forother (4v4, 3v3, penalty shots): 0.09 xG forpenalty kill: 0.99 xG againstother (4v4, 3v3, penalty shots): 0.19 xG against-1.0823.2%
+0.25−0.25+0.5−0.5+0.75−0.75+1−10Andrew PeekeD20:165v5 offense: 0.98 xG for vs 0.71 expected (+0.27) in 17:255v5 defense: 0.61 xG against vs 0.71 expected (+0.11) in 17:25penalty kill: 0.01 xG for vs 0.04 expected, 0.10 against vs 0.38 expected (+0.25) in 2:51+0.62Michael CarconeF11:295v5 offense: 0.65 xG for vs 0.42 expected (+0.23) in 10:20power play: 0.01 xG for vs 0.14 expected, 0.00 against vs 0.01 expected (-0.11) in 1:015v5 defense: 0.31 xG against vs 0.42 expected (+0.11) in 10:20penalty kill: 0.00 xG for vs 0.00 expected, 0.00 against vs 0.02 expected (+0.02) in 0:08+0.25Barrett HaytonF17:305v5 offense: 0.26 xG for vs 0.52 expected (-0.26) in 12:33power play: 0.41 xG for vs 0.48 expected, 0.00 against vs 0.05 expected (-0.02) in 3:335v5 defense: 0.16 xG against vs 0.52 expected (+0.35) in 12:33penalty kill: 0.01 xG for vs 0.02 expected, 0.02 against vs 0.19 expected (+0.16) in 1:24+0.24Zac JonesD11:005v5 offense: 0.40 xG for vs 0.44 expected (-0.04) in 10:49power play: 0.01 xG for vs 0.02 expected, 0.00 against vs 0.00 expected (-0.01) in 0:115v5 defense: 0.21 xG against vs 0.44 expected (+0.23) in 10:49+0.18Lawson CrouseF17:345v5 offense: 0.52 xG for vs 0.50 expected (+0.02) in 12:15power play: 0.00 xG for vs 0.10 expected, 0.00 against vs 0.01 expected (-0.09) in 0:455v5 defense: 0.30 xG against vs 0.50 expected (+0.20) in 12:15penalty kill: 0.15 xG for vs 0.06 expected, 0.75 against vs 0.61 expected (-0.05) in 4:34+0.08Vincent TrocheckF24:115v5 offense: 0.70 xG for vs 0.69 expected (+0.00) in 16:54power play: 0.41 xG for vs 0.59 expected, 0.00 against vs 0.06 expected (-0.12) in 4:255v5 defense: 0.55 xG against vs 0.69 expected (+0.15) in 16:54penalty kill: 0.01 xG for vs 0.04 expected, 0.34 against vs 0.38 expected (+0.01) in 2:52+0.04Anders LeeF15:435v5 offense: 0.67 xG for vs 0.60 expected (+0.07) in 14:44power play: 0.01 xG for vs 0.13 expected, 0.00 against vs 0.01 expected (-0.11) in 0:595v5 defense: 0.54 xG against vs 0.60 expected (+0.06) in 14:44+0.03Mikhail SergachevD24:505v5 offense: 0.83 xG for vs 0.69 expected (+0.14) in 16:51power play: 0.36 xG for vs 0.57 expected, 0.00 against vs 0.06 expected (-0.15) in 4:135v5 defense: 0.80 xG against vs 0.69 expected (-0.11) in 16:51penalty kill: 0.03 xG for vs 0.05 expected, 0.34 against vs 0.50 expected (+0.13) in 3:46+0.01Artem DudaD13:125v5 offense: 0.35 xG for vs 0.54 expected (-0.19) in 13:07power play: 0.00 xG for vs 0.01 expected, 0.00 against vs 0.00 expected (-0.01) in 0:055v5 defense: 0.33 xG against vs 0.54 expected (+0.21) in 13:07+0.00Daniil ButF9:355v5 offense: 0.25 xG for vs 0.36 expected (-0.11) in 8:41power play: 0.00 xG for vs 0.12 expected, 0.00 against vs 0.01 expected (-0.11) in 0:545v5 defense: 0.15 xG against vs 0.36 expected (+0.21) in 8:41-0.01Liam O'BrienF2:515v5 offense: 0.00 xG for vs 0.12 expected (-0.12) in 2:515v5 defense: 0.01 xG against vs 0.12 expected (+0.10) in 2:51-0.01Jack McBainF15:335v5 offense: 0.61 xG for vs 0.46 expected (+0.14) in 11:16power play: 0.01 xG for vs 0.04 expected, 0.00 against vs 0.00 expected (-0.02) in 0:165v5 defense: 0.29 xG against vs 0.46 expected (+0.17) in 11:16penalty kill: 0.00 xG for vs 0.06 expected, 0.84 against vs 0.53 expected (-0.36) in 4:01-0.07Ben McCartneyF4:525v5 offense: 0.02 xG for vs 0.20 expected (-0.18) in 4:525v5 defense: 0.11 xG against vs 0.20 expected (+0.09) in 4:52-0.08Clayton KellerF21:575v5 offense: 0.76 xG for vs 0.72 expected (+0.05) in 17:30power play: 0.41 xG for vs 0.60 expected, 0.00 against vs 0.06 expected (-0.13) in 4:275v5 defense: 0.83 xG against vs 0.72 expected (-0.11) in 17:30-0.19Kevin StenlundF11:185v5 offense: 0.03 xG for vs 0.39 expected (-0.36) in 9:365v5 defense: 0.47 xG against vs 0.39 expected (-0.08) in 9:36penalty kill: 0.15 xG for vs 0.02 expected, 0.12 against vs 0.23 expected (+0.23) in 1:42-0.21Dmitri SimashevD18:585v5 offense: 0.45 xG for vs 0.60 expected (-0.16) in 14:40power play: 0.00 xG for vs 0.10 expected, 0.00 against vs 0.01 expected (-0.09) in 0:435v5 defense: 0.47 xG against vs 0.60 expected (+0.13) in 14:40penalty kill: 0.14 xG for vs 0.05 expected, 0.75 against vs 0.48 expected (-0.18) in 3:35-0.29Kailer YamamotoF17:275v5 offense: 0.27 xG for vs 0.52 expected (-0.25) in 12:36power play: 0.41 xG for vs 0.59 expected, 0.00 against vs 0.06 expected (-0.12) in 4:255v5 defense: 0.46 xG against vs 0.52 expected (+0.05) in 12:36penalty kill: 0.00 xG for vs 0.01 expected, 0.11 against vs 0.06 expected (-0.06) in 0:26-0.37MacKenzie WeegarD22:455v5 offense: 0.16 xG for vs 0.68 expected (-0.53) in 16:35power play: 0.06 xG for vs 0.16 expected, 0.00 against vs 0.02 expected (-0.08) in 1:135v5 defense: 0.36 xG against vs 0.68 expected (+0.32) in 16:35penalty kill: 0.15 xG for vs 0.07 expected, 0.99 against vs 0.66 expected (-0.25) in 4:57-0.54
0.250.250.50.50.750.75110Andrew PeekeD17:25+0.3761.6%Michael CarconeF10:20+0.3467.7%Jack McBainF11:16+0.3267.7%Lawson CrouseF12:15+0.2263.2%Zac JonesD10:49+0.2065.9%Vincent TrocheckF16:54+0.1556.1%Anders LeeF14:44+0.1355.5%Barrett HaytonF12:33+0.1061.8%Daniil ButF8:41+0.1062.5%Mikhail SergachevD16:51+0.0351.0%Artem DudaD13:07+0.0151.1%Liam O'BrienF2:51-0.010.0%Dmitri SimashevD14:40-0.0348.5%Clayton KellerF17:30-0.0648.0%Ben McCartneyF4:52-0.0817.8%Kailer YamamotoF12:36-0.1936.9%MacKenzie WeegarD16:35-0.2130.0%Kevin StenlundF9:36-0.446.5%
+0.25−0.25+0.5−0.5+0.75−0.750Andrew PeekeD17:255v5 offense: 0.98 xG for vs 0.71 expected (+0.27) in 17:255v5 defense: 0.61 xG against vs 0.71 expected (+0.11) in 17:25+0.37Michael CarconeF10:205v5 offense: 0.65 xG for vs 0.42 expected (+0.23) in 10:205v5 defense: 0.31 xG against vs 0.42 expected (+0.11) in 10:20+0.34Jack McBainF11:165v5 offense: 0.61 xG for vs 0.46 expected (+0.14) in 11:165v5 defense: 0.29 xG against vs 0.46 expected (+0.17) in 11:16+0.32Lawson CrouseF12:155v5 offense: 0.52 xG for vs 0.50 expected (+0.02) in 12:155v5 defense: 0.30 xG against vs 0.50 expected (+0.20) in 12:15+0.22Zac JonesD10:495v5 offense: 0.40 xG for vs 0.44 expected (-0.04) in 10:495v5 defense: 0.21 xG against vs 0.44 expected (+0.23) in 10:49+0.20Vincent TrocheckF16:545v5 offense: 0.70 xG for vs 0.69 expected (+0.00) in 16:545v5 defense: 0.55 xG against vs 0.69 expected (+0.15) in 16:54+0.15Anders LeeF14:445v5 offense: 0.67 xG for vs 0.60 expected (+0.07) in 14:445v5 defense: 0.54 xG against vs 0.60 expected (+0.06) in 14:44+0.13Barrett HaytonF12:335v5 offense: 0.26 xG for vs 0.52 expected (-0.26) in 12:335v5 defense: 0.16 xG against vs 0.52 expected (+0.35) in 12:33+0.10Daniil ButF8:415v5 offense: 0.25 xG for vs 0.36 expected (-0.11) in 8:415v5 defense: 0.15 xG against vs 0.36 expected (+0.21) in 8:41+0.10Mikhail SergachevD16:515v5 offense: 0.83 xG for vs 0.69 expected (+0.14) in 16:515v5 defense: 0.80 xG against vs 0.69 expected (-0.11) in 16:51+0.03Artem DudaD13:075v5 offense: 0.35 xG for vs 0.54 expected (-0.19) in 13:075v5 defense: 0.33 xG against vs 0.54 expected (+0.21) in 13:07+0.01Liam O'BrienF2:515v5 offense: 0.00 xG for vs 0.12 expected (-0.12) in 2:515v5 defense: 0.01 xG against vs 0.12 expected (+0.10) in 2:51-0.01Dmitri SimashevD14:405v5 offense: 0.45 xG for vs 0.60 expected (-0.16) in 14:405v5 defense: 0.47 xG against vs 0.60 expected (+0.13) in 14:40-0.03Clayton KellerF17:305v5 offense: 0.76 xG for vs 0.72 expected (+0.05) in 17:305v5 defense: 0.83 xG against vs 0.72 expected (-0.11) in 17:30-0.06Ben McCartneyF4:525v5 offense: 0.02 xG for vs 0.20 expected (-0.18) in 4:525v5 defense: 0.11 xG against vs 0.20 expected (+0.09) in 4:52-0.08Kailer YamamotoF12:365v5 offense: 0.27 xG for vs 0.52 expected (-0.25) in 12:365v5 defense: 0.46 xG against vs 0.52 expected (+0.05) in 12:36-0.19MacKenzie WeegarD16:355v5 offense: 0.16 xG for vs 0.68 expected (-0.53) in 16:355v5 defense: 0.36 xG against vs 0.68 expected (+0.32) in 16:35-0.21Kevin StenlundF9:365v5 offense: 0.03 xG for vs 0.39 expected (-0.36) in 9:365v5 defense: 0.47 xG against vs 0.39 expected (-0.08) in 9:36-0.44
0.250.250.50.50Clayton KellerF4:27+0.41100.0%Vincent TrocheckF4:25+0.41100.0%Kailer YamamotoF4:25+0.41100.0%Barrett HaytonF3:33+0.41100.0%Mikhail SergachevD4:13+0.36100.0%MacKenzie WeegarD1:13+0.06100.0%Michael CarconeF1:01+0.01100.0%Anders LeeF0:59+0.01100.0%Jack McBainF0:16+0.01100.0%Zac JonesD0:11+0.01100.0%Daniil ButF0:54+0.00100.0%Lawson CrouseF0:45+0.00100.0%Dmitri SimashevD0:43+0.00—Artem DudaD0:05+0.00—
+0.25−0.250Artem DudaD0:05power play: 0.00 xG for vs 0.01 expected, 0.00 against vs 0.00 expected (-0.01) in 0:05-0.01Zac JonesD0:11power play: 0.01 xG for vs 0.02 expected, 0.00 against vs 0.00 expected (-0.01) in 0:11-0.01Barrett HaytonF3:33power play: 0.41 xG for vs 0.48 expected, 0.00 against vs 0.05 expected (-0.02) in 3:33-0.02Jack McBainF0:16power play: 0.01 xG for vs 0.04 expected, 0.00 against vs 0.00 expected (-0.02) in 0:16-0.02MacKenzie WeegarD1:13power play: 0.06 xG for vs 0.16 expected, 0.00 against vs 0.02 expected (-0.08) in 1:13-0.08Dmitri SimashevD0:43power play: 0.00 xG for vs 0.10 expected, 0.00 against vs 0.01 expected (-0.09) in 0:43-0.09Lawson CrouseF0:45power play: 0.00 xG for vs 0.10 expected, 0.00 against vs 0.01 expected (-0.09) in 0:45-0.09Daniil ButF0:54power play: 0.00 xG for vs 0.12 expected, 0.00 against vs 0.01 expected (-0.11) in 0:54-0.11Anders LeeF0:59power play: 0.01 xG for vs 0.13 expected, 0.00 against vs 0.01 expected (-0.11) in 0:59-0.11Michael CarconeF1:01power play: 0.01 xG for vs 0.14 expected, 0.00 against vs 0.01 expected (-0.11) in 1:01-0.11Vincent TrocheckF4:25power play: 0.41 xG for vs 0.59 expected, 0.00 against vs 0.06 expected (-0.12) in 4:25-0.12Kailer YamamotoF4:25power play: 0.41 xG for vs 0.59 expected, 0.00 against vs 0.06 expected (-0.12) in 4:25-0.12Clayton KellerF4:27power play: 0.41 xG for vs 0.60 expected, 0.00 against vs 0.06 expected (-0.13) in 4:27-0.13Mikhail SergachevD4:13power play: 0.36 xG for vs 0.57 expected, 0.00 against vs 0.06 expected (-0.15) in 4:13-0.15
0.250.250.50.50.750.75110Kevin StenlundF1:42+0.0355.7%Michael CarconeF0:08+0.00—Barrett HaytonF1:24-0.0043.3%Andrew PeekeD2:51-0.0912.6%Kailer YamamotoF0:26-0.110.0%Mikhail SergachevD3:46-0.326.9%Vincent TrocheckF2:52-0.334.1%Lawson CrouseF4:34-0.5917.1%Dmitri SimashevD3:35-0.6116.1%MacKenzie WeegarD4:57-0.8413.5%Jack McBainF4:01-0.840.3%
+0.25−0.25+0.5−0.50Andrew PeekeD2:51penalty kill: 0.01 xG for vs 0.04 expected, 0.10 against vs 0.38 expected (+0.25) in 2:51+0.25Kevin StenlundF1:42penalty kill: 0.15 xG for vs 0.02 expected, 0.12 against vs 0.23 expected (+0.23) in 1:42+0.23Barrett HaytonF1:24penalty kill: 0.01 xG for vs 0.02 expected, 0.02 against vs 0.19 expected (+0.16) in 1:24+0.16Mikhail SergachevD3:46penalty kill: 0.03 xG for vs 0.05 expected, 0.34 against vs 0.50 expected (+0.13) in 3:46+0.13Michael CarconeF0:08penalty kill: 0.00 xG for vs 0.00 expected, 0.00 against vs 0.02 expected (+0.02) in 0:08+0.02Vincent TrocheckF2:52penalty kill: 0.01 xG for vs 0.04 expected, 0.34 against vs 0.38 expected (+0.01) in 2:52+0.01Lawson CrouseF4:34penalty kill: 0.15 xG for vs 0.06 expected, 0.75 against vs 0.61 expected (-0.05) in 4:34-0.05Kailer YamamotoF0:26penalty kill: 0.00 xG for vs 0.01 expected, 0.11 against vs 0.06 expected (-0.06) in 0:26-0.06Dmitri SimashevD3:35penalty kill: 0.14 xG for vs 0.05 expected, 0.75 against vs 0.48 expected (-0.18) in 3:35-0.18MacKenzie WeegarD4:57penalty kill: 0.15 xG for vs 0.07 expected, 0.99 against vs 0.66 expected (-0.25) in 4:57-0.25Jack McBainF4:01penalty kill: 0.00 xG for vs 0.06 expected, 0.84 against vs 0.53 expected (-0.36) in 4:01-0.36

Lines & pairs

all · whole game · this game
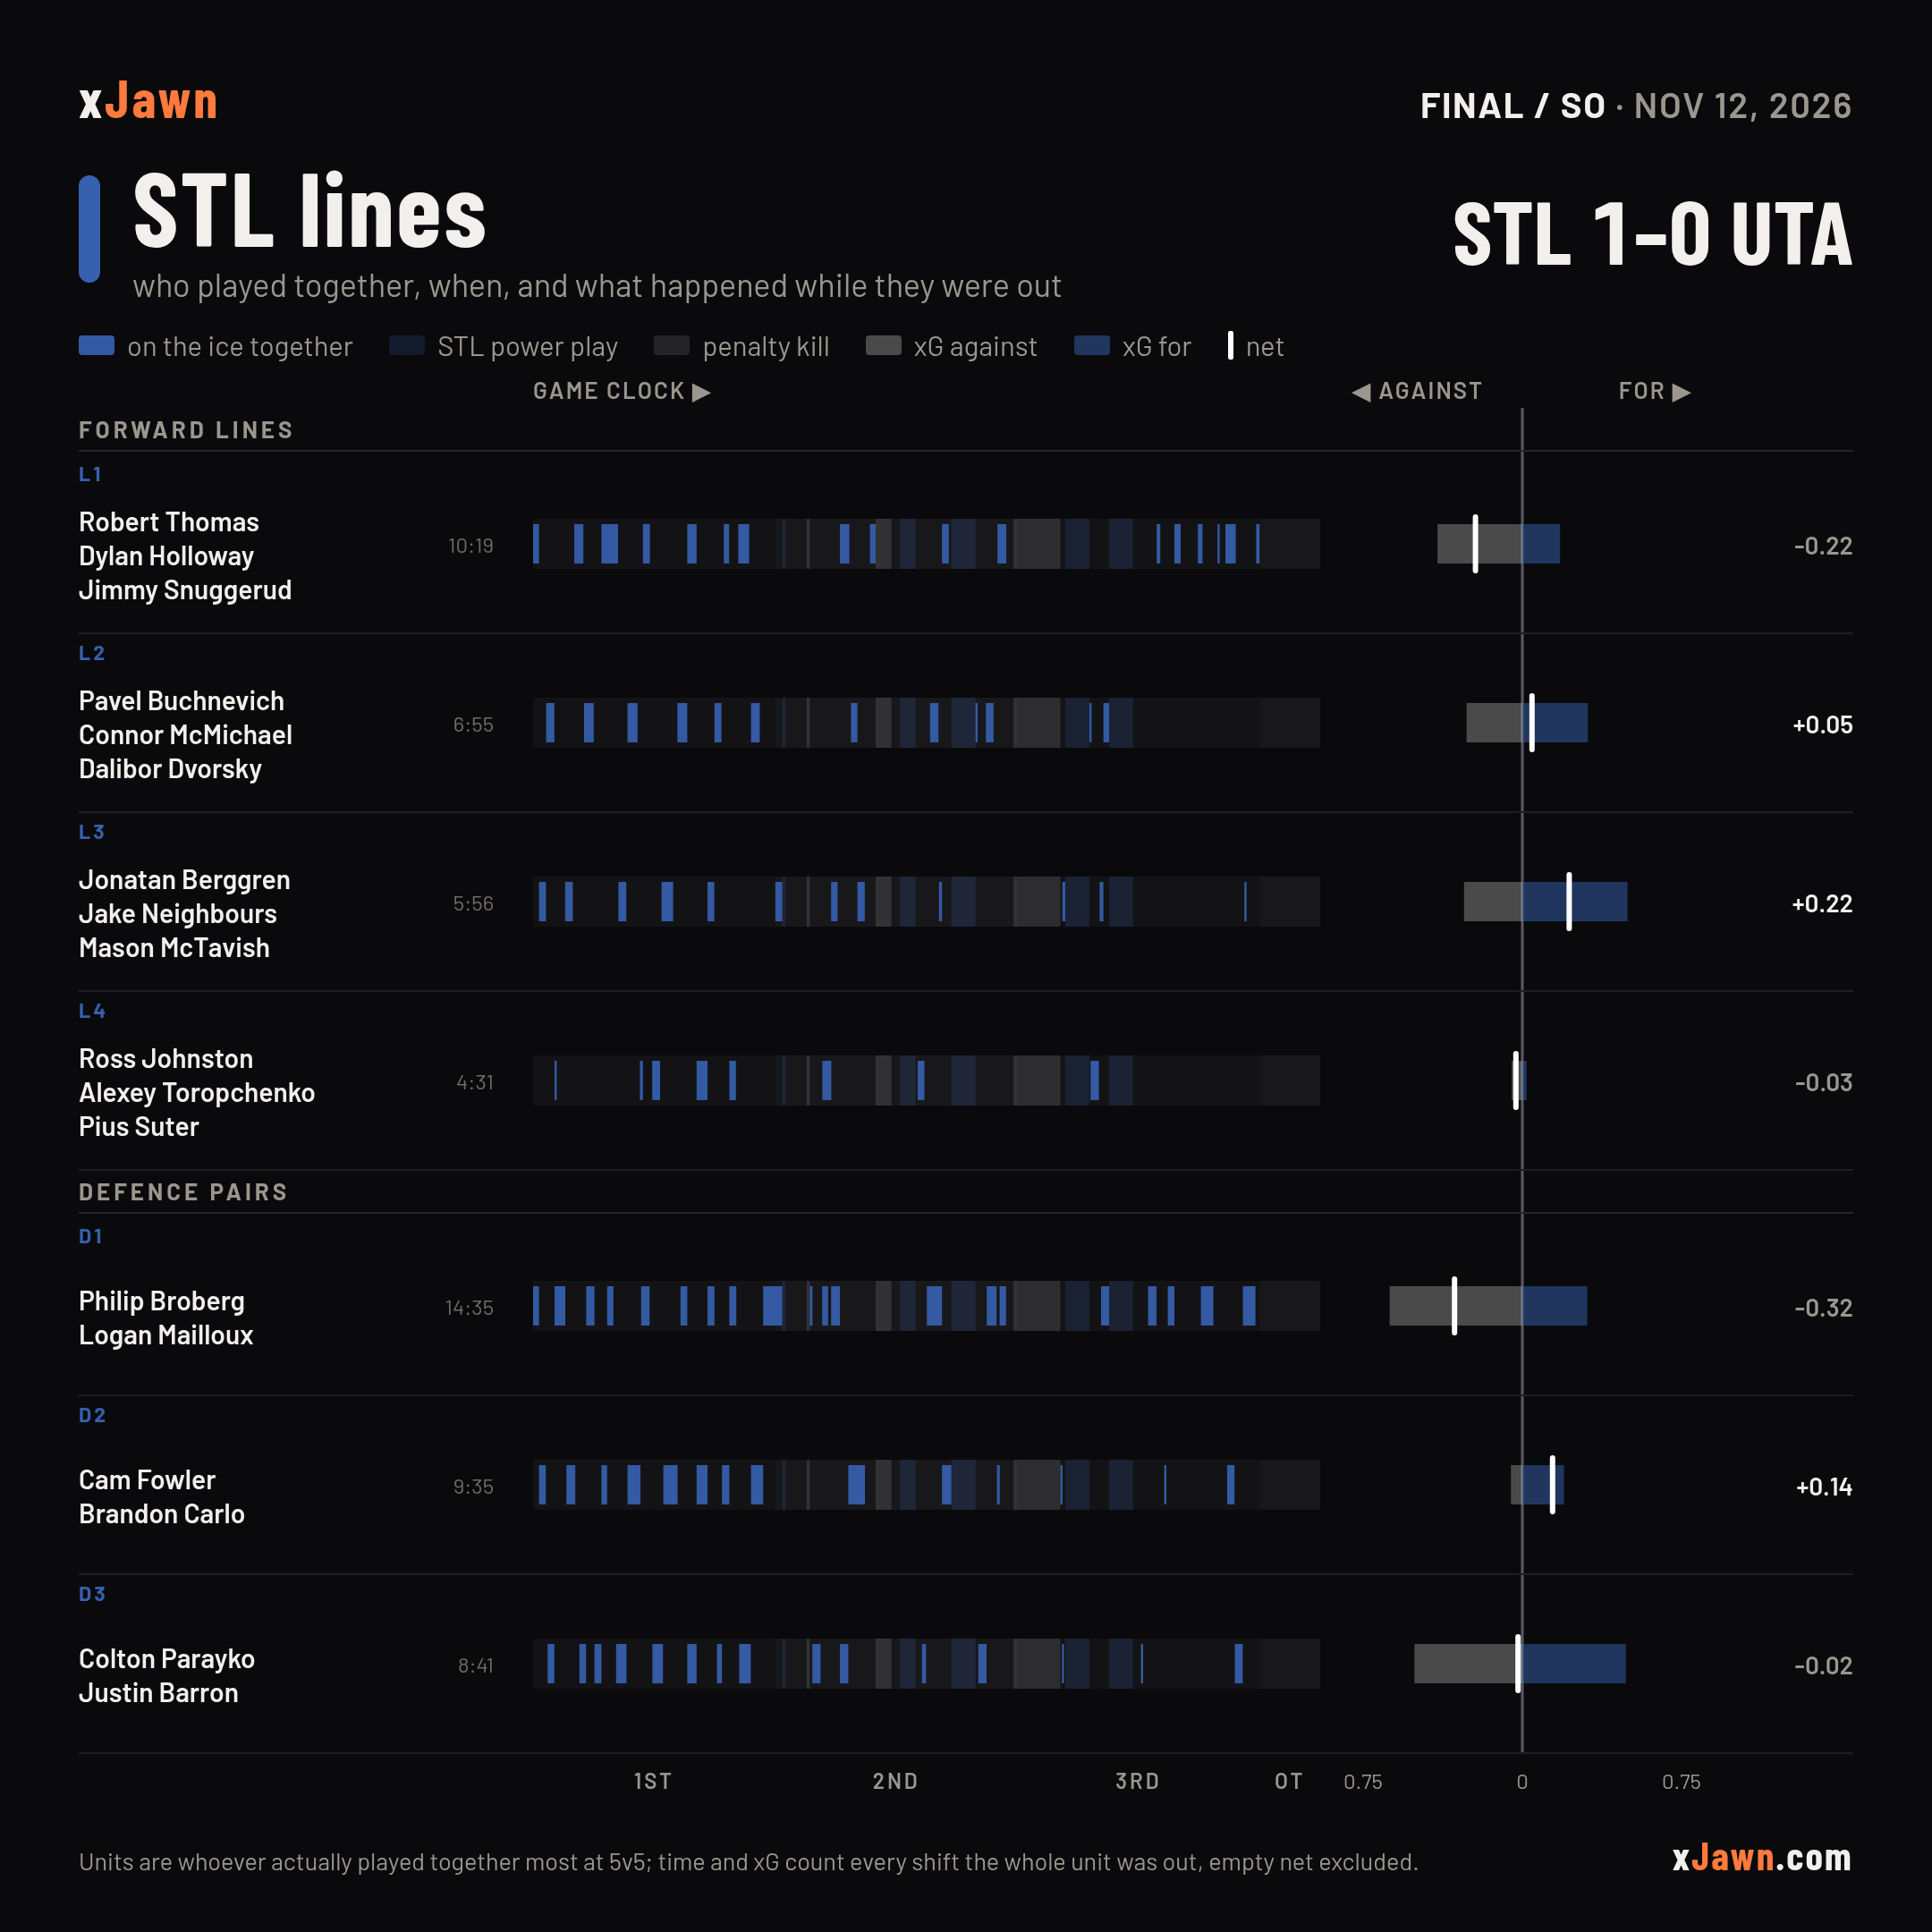
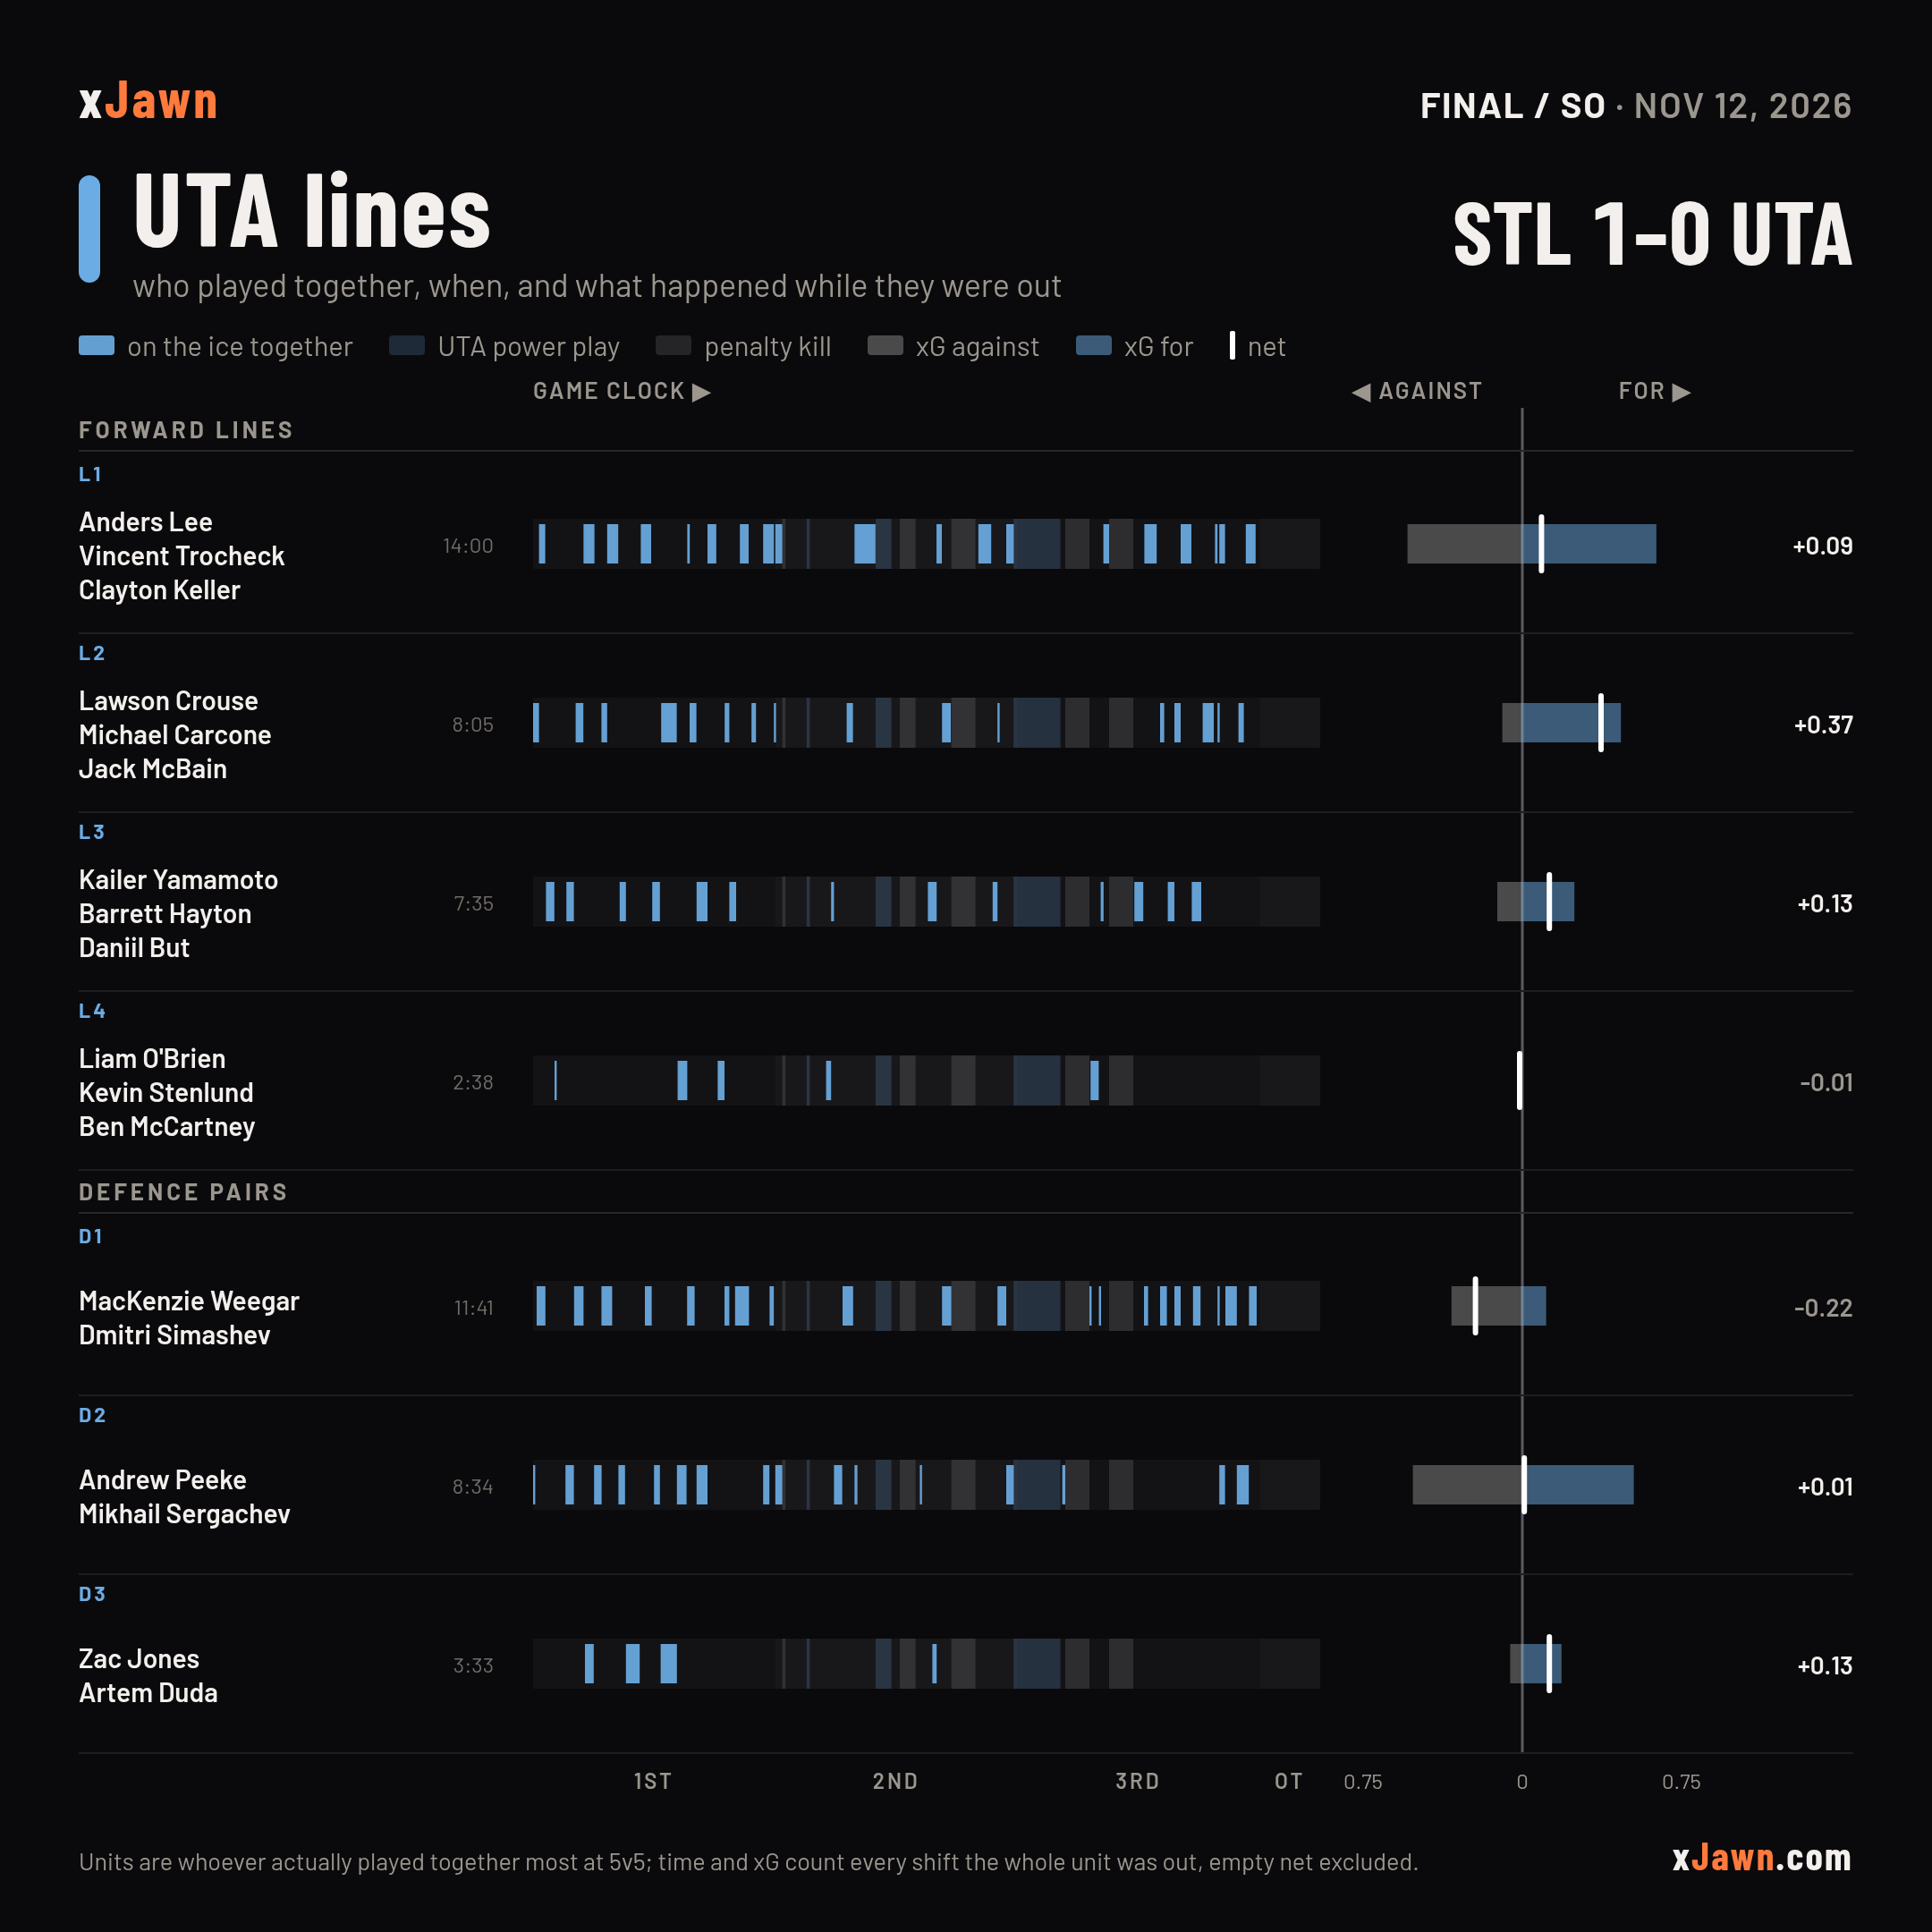
Each team's most-used units: when they were on, and the xG for and against. lines are by strength · 5v5 shown
How to read this

The units that actually played together most at the chosen strength — forward lines and defence pairs at 5v5, the whole group on the ice on the power play or the kill — each with when it was on the ice at that strength across the game clock (period and power-play bands behind the strip) and on-ice xG against / for while the whole unit was out, at that strength only. Sorted by time together; pick another key to re-order, and a name opens the player's page. Pick a period and the strip veils the rest of the game while the bars re-lay for that period alone, on the whole game's scale. The Column switch shows each unit's xGF% on the right instead of net xG.

STL
on ice power play penalty kill xGA xGF
UTA
on ice power play penalty kill xGA xGF
FORWARD LINESL1Anders LeeVincent TrocheckClayton Keller14:00+0.0953.8%L2Lawson CrouseMichael CarconeJack McBain8:05+0.3783.2%L3Kailer YamamotoBarrett HaytonDaniil But7:35+0.1367.5%L4Liam O'BrienKevin StenlundBen McCartney2:38-0.010.0%DEFENCE PAIRSD1MacKenzie WeegarDmitri Simashev11:41-0.2225.2%D2Andrew PeekeMikhail Sergachev8:34+0.0150.4%D3Zac JonesArtem Duda3:33+0.1376.3%1ST2ND3RDOT00.750.75
PENALTY-KILL UNITSPK1Lawson CrouseAndrew PeekeJack McBainDmitri Simashev1:09-0.080.0%PK2MacKenzie WeegarLawson CrouseJack McBainDmitri Simashev0:59-0.440.0%PK3Vincent TrocheckMacKenzie WeegarMikhail SergachevJack McBain0:48-0.320.0%SPAREKevin Stenlund1:42+0.0355.7%SPAREBarrett Hayton1:24-0.0043.3%SPAREKailer Yamamoto0:26-0.110.0%SPAREMichael Carcone0:08+0.00—1ST2ND3RDOT00.50.5

Matchups

5v5 · this game
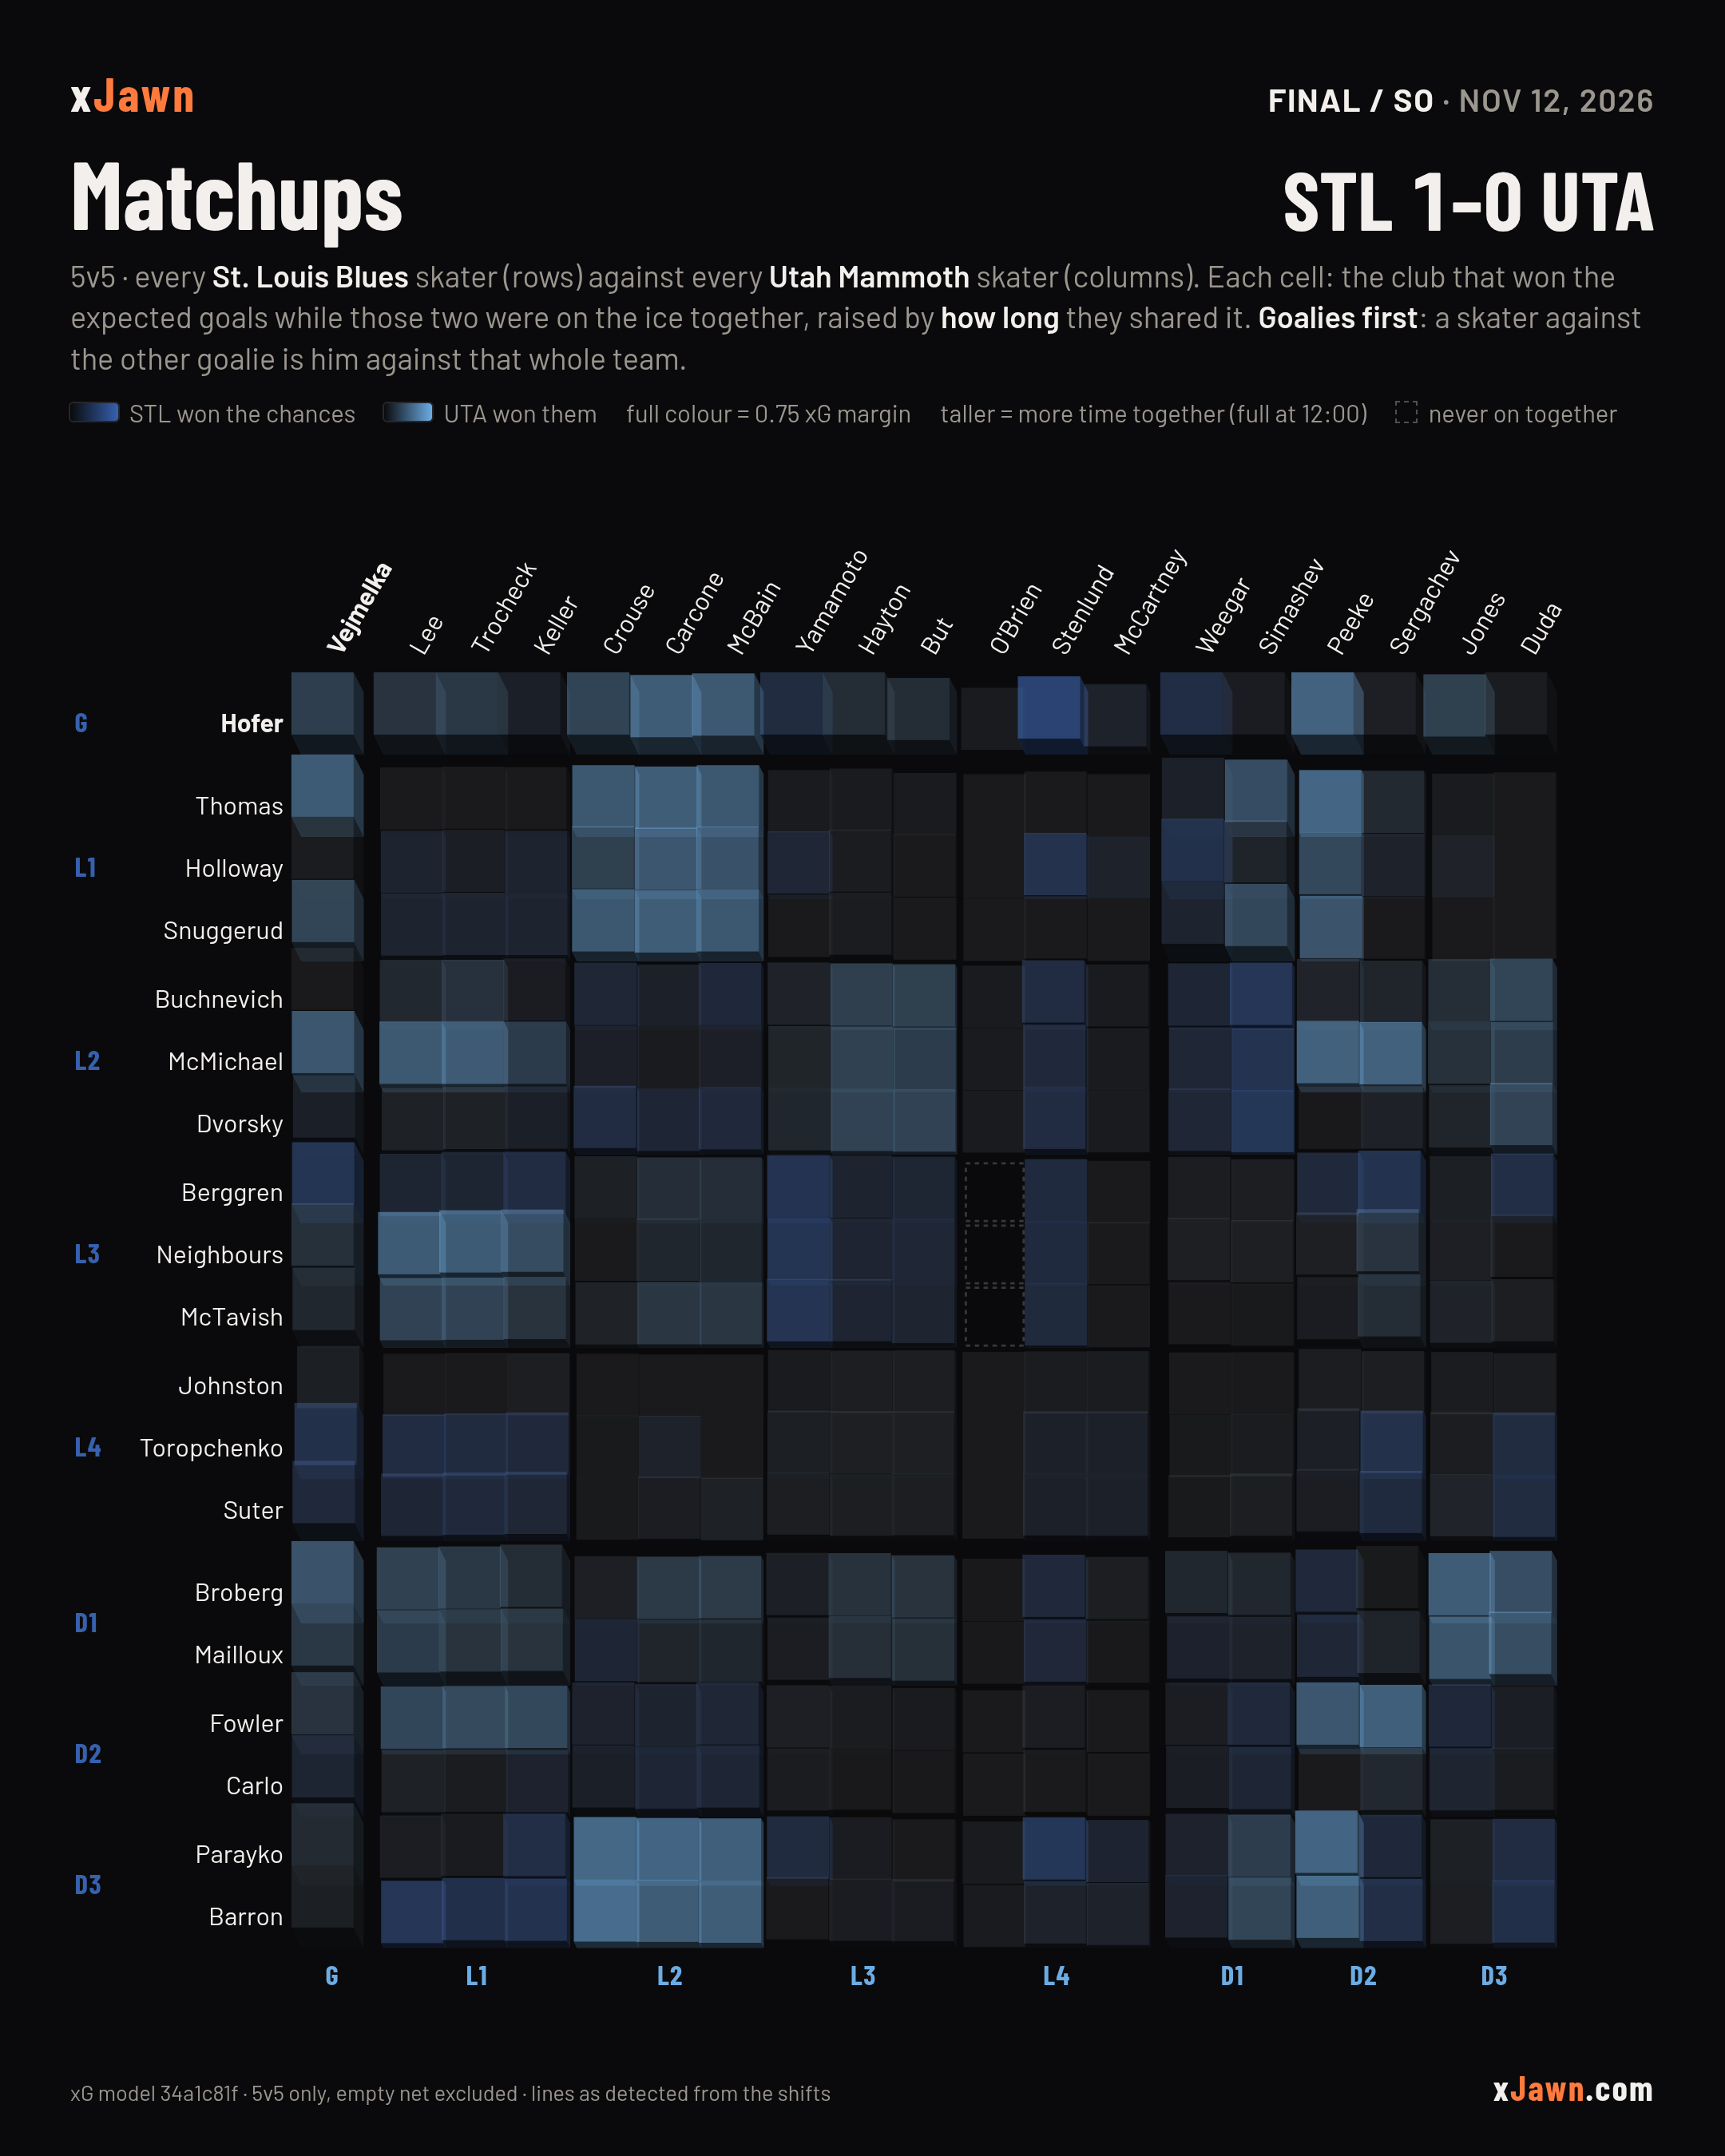
How each STL skater did against each UTA skater at 5v5; the colour is who won the chances.
Order
STL won the chances UTA won them full colour = a margin of 0.75 xG or more taller = more time together (full height at 12:00) on together, dead even never on together G = goalie: his row or column is each skater against the whole other team
VejmelkaLeeTrocheckKellerCrouseCarconeMcBainYamamotoHaytonButO'BrienStenlundMcCartneyWeegarSimashevPeekeSergachevJonesDudaGL1L2L3L4D1D2D3GL1L2L3L4D1D2D3HoferThomasHollowaySnuggerudBuchnevichMcMichaelDvorskyBerggrenNeighboursMcTavishJohnstonToropchenkoSuterBrobergMaillouxFowlerCarloParaykoBarron
How to read this

Rows are STL's skaters, columns UTA's, grouped the way they played: forward lines (L1 = the line that played together most), then defence pairs. Each cell covers the five-on-five time those two players shared the ice. Its colour is the club that out-chanced the other in that time — expected goals for minus against — and the stronger the colour, the bigger the margin. Each cell is also raised: the taller the block, the longer the two shared the ice, up to full height at 12:00 of five-on-five time. A grey cell means they met and it came out even; an open, flat one means they never met at five-on-five.

The first row and column are the goalies. A goalie is in net for every five-on-five second, so a skater's cell against the other side's goalie is all of that skater's five-on-five time against that team — the rest of his row or column added up — and the corner where the two goalies meet is the game's five-on-five. Those cells cover far more time than any pair, so they reach full colour sooner and stand at full height, a wall along each edge of the grid. A goalie change adds a second goalie row or column, each covering his own time.

Linemates share the ice, so a line against a line reads as a block. The margin is a total, not a rate: a long matchup has room to build a big gap and a thirty-second one does not — which is what the height is there to show: a tall, strong cell is the game's story; a short, strong one is a moment. Hover (or tap) any cell for the exact time together, the xG each way, attempts and goals. One game — a strong cell is what happened, not what would happen again.

The forecasthow the call scored · the score grid · the pregame read · the predicted map · tale of the tape
The model

The prediction, scored

🔒 pregame · this game

Before puck drop we made STL a 53.1% favorite; the call landed. The engine expected a 3.16–2.94 game and STL won 1–0. Every number in this section was issued before the game and is never re-graded.

pred. xGactual xG pred. 5v5actual 5v5 pred. STactual PP
STL 3.163.02 2.211.39 0.861.09
UTA 2.942.48 2.051.58 0.760.42

Predicted 5v5 / special-teams portions come from the predicted map's strength splits (one shared scale per team pins the all-strengths total to its expected goals), so they don't sum exactly — the remainder is 4v4, 3v3, and other mixed states. The actual columns are the card's own counts (empty-net attempts excluded); the actual PP column is power-play xG only, the same bucket the predicted map's special-teams view draws.

The pregame score grid

🔒 pregame · this game

The likeliest finals before the game, with the real one marked. ■ STL · ■ UTA

Likeliest finals (STL–UTA)probability
3–3 7.1% tied after regulation — OT/SO decides
2–2 6.9% tied after regulation — OT/SO decides
4–2 4.2%
4–4 4.1% tied after regulation — OT/SO decides
2–4 3.7%
0–0 0.3% what happened — regulation ended tied; STL won in SO
4.3%5.4%013.5%15.6%121.1%22.8%222.1%22.2%317.5%16.3%411.2%9.7%56.0%4.9%62.7%2.1%71.6%1.1%8+

Scoreline odds are the engine's own grid: each team's goals as a Poisson count, with the fitted adjustment for how often games end tied after regulation (ρ = 0.35), so these odds and the headline win probability come from the same numbers. The OT/SO layer is a separate fitted model and is already inside the headline win probability.

The pregame read

🔒 pregame · this game

Why the engine leaned STL, piece by piece. The engine made STL a 53.1% favorite — UTA controls 48.2% of the predicted xG. Of STL's 3.16 expected goals, 2.21 should come at 5v5 and 0.86 on the power play; UTA projects 2.05 at 5v5 and 0.76 on the power play.

Why STL 53.1%
win chance× expected goals
schedule +4.6 STL ×1.04 · UTA ×0.95
home ice −4.1 STL ×1.00 · UTA ×1.09
finishing +4.0 STL ×1.04 · UTA ×0.95
special teams −1.1 STL ×0.97 · UTA ×0.99
goaltending +1.1 STL ×1.03 · UTA ×1.00
5v5 play −0.9 STL ×1.01 · UTA ×1.03

Bars right of the line push toward STL, left toward UTA. Win chance is in points toward STL. Each win-chance number is one-at-a-time: that piece reset to league average (neutral ice, a typical night's rest) on both sides and the game re-priced; the pieces interact, so they don't add up to the call. The multipliers are exact: a league-average team on neutral ice, on a typical night's rest, would expect 2.93 goals in this game, and each side's expected goals is that times its column of multipliers. Special teams reads small because the engine's power-play terms fit near zero, not because special teams don't matter.

Where the engine expected the goals

🔒 pregame · this game

Where the engine expected each team's chances, before puck drop. The predicted surface — not this game's shots (those are the card's map above). STL attacks the left net, UTA the right; each end multiplies where the attacking team generates xG this season by where its opponent concedes it, scaled so each end totals the engine's expected goals. Actual shots lays the game's unblocked attempts on top: × goals, • on net, ◦ missed.

Context

Tale of the tape

season to date

Each team's season so far, with its league rank (1 is best). Per-game xG rates, ranked of 32 — orange ranks sit in the top third of the league, gray in the bottom third.

STLUTA
2.96 (14th) Offense
xG for / game
3.44 (2nd)
2.74 (12th) Defense
xG against / game
2.68 (9th)
0.69 (24th) Power play
PP xG / game
0.93 (3rd)
0.70 (11th) Penalty kill
PP xG conceded / game
0.82 (25th)

Season-to-date form as of the site's latest build, shown for context — the ratings the engine actually used were its own as-of-game-day state. Replay this matchup in the lab →