How the Flyers are using Michkov
Ten games in, Matvei Michkov is a specialist: full power play, no penalty kill, third-line minutes at 5v5 and offensive-zone starts. It is the same job as last year with less shelter and longer shifts, and the score, not the period, is what moves his ice time. The on-ice numbers are here for you to read either way.
TL;DR. Ten games in, the Flyers are using Matvei Michkov as a specialist: full power play (2:57 a night), no penalty kill, third-line minutes at 5v5 (11:19, 8th of 13 forwards). It is the same job he had last year, with less shelter and longer shifts. The third period does not change his ice time. The score does.
This is the long version of this morning's thread, with the same six pictures and the numbers behind them. Everything below is the regular season to date, 10 games, from the NHL's shift charts and play-by-play. "Forward" means the 13 Flyers forwards with at least five games.
The job
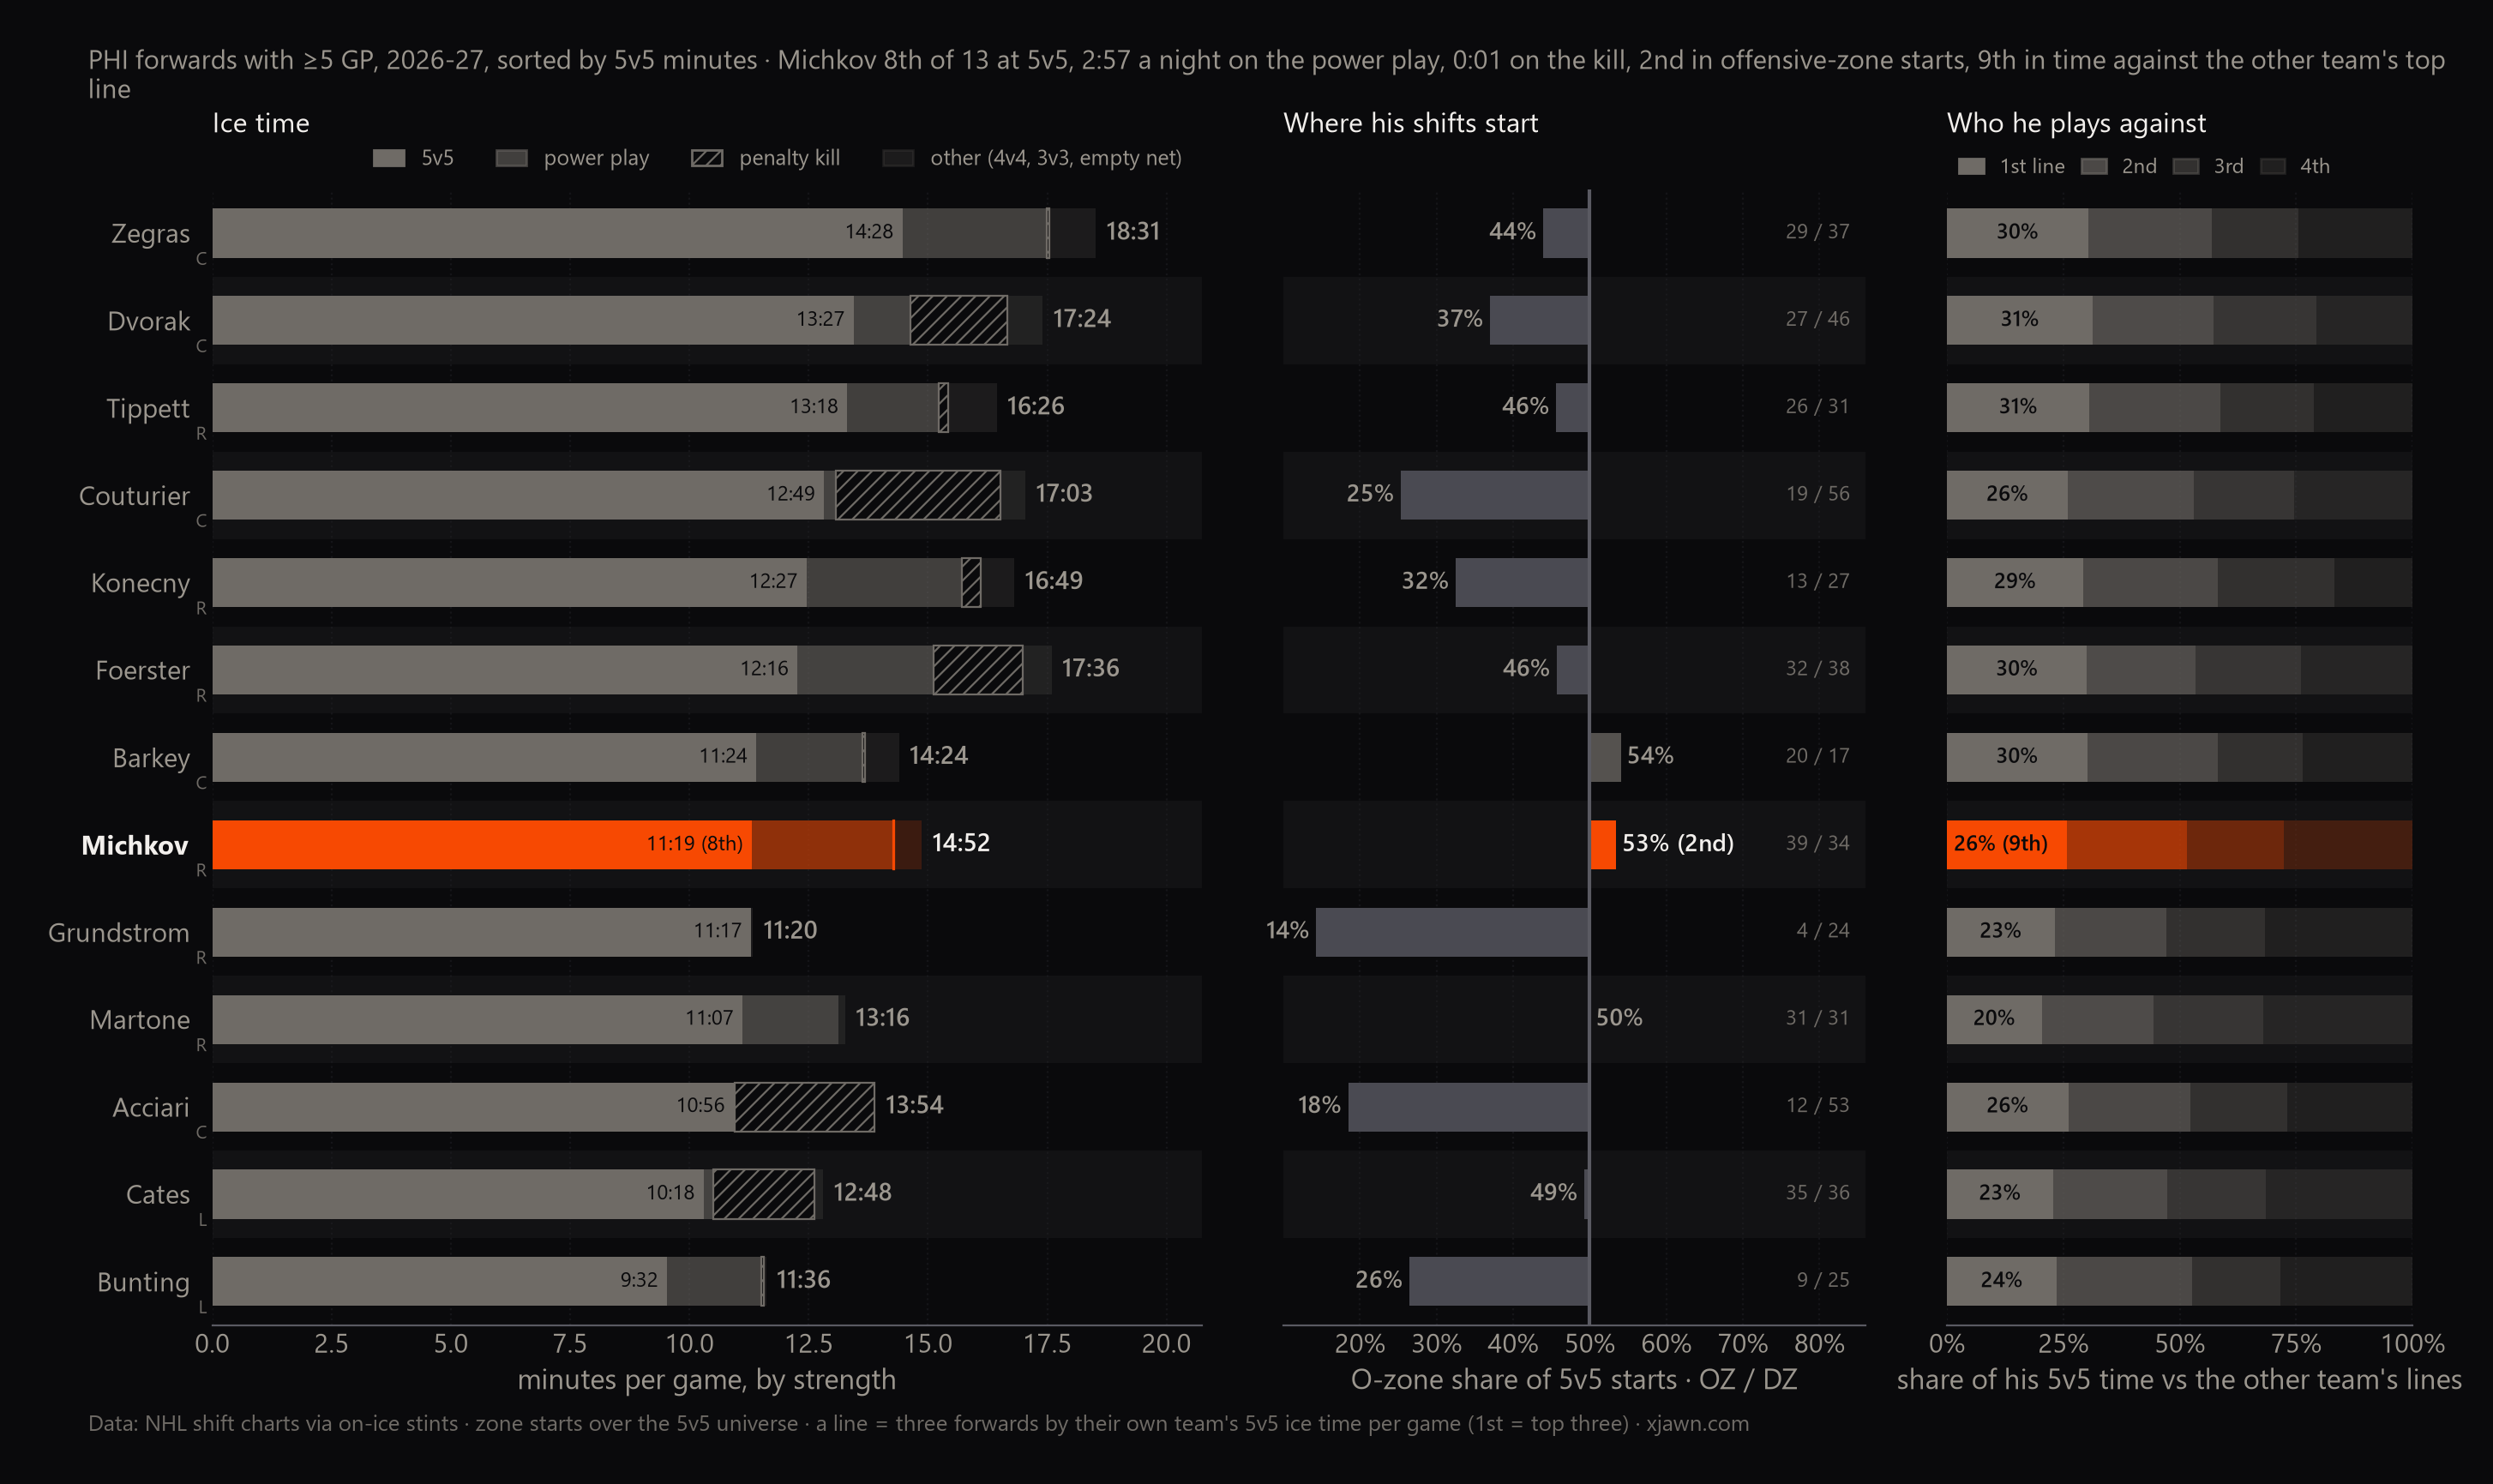
Three things describe how a coach uses a forward: how much he plays at each strength, where his shifts start, and who he plays against. Michkov's answers are consistent.
- Strength. 11:19 a night at 5v5, 8th of 13 forwards. 2:57 on the power play, 3rd. Essentially no penalty kill. The all-situations number (14:52, 7th) looks like a middle-six forward; the 5v5 number is a third-liner's.
- Zone starts. When his shift starts at a faceoff, it is in the attacking zone 39 times and in his own zone 34 times, 53% offensive, 2nd on the team. The forwards who play ahead of him at 5v5 start in their own end: Couturier 25%, Dvorak 37%, Konecny 32%.
- Competition. 26% of his 5v5 time is against the other team's top line, 26% the second, 21% the third, 28% the fourth. Flat, and 9th among the forwards in time against top lines. A "line" here is three forwards by their own team's 5v5 ice time, so the number has no model in it.
Same job as last year
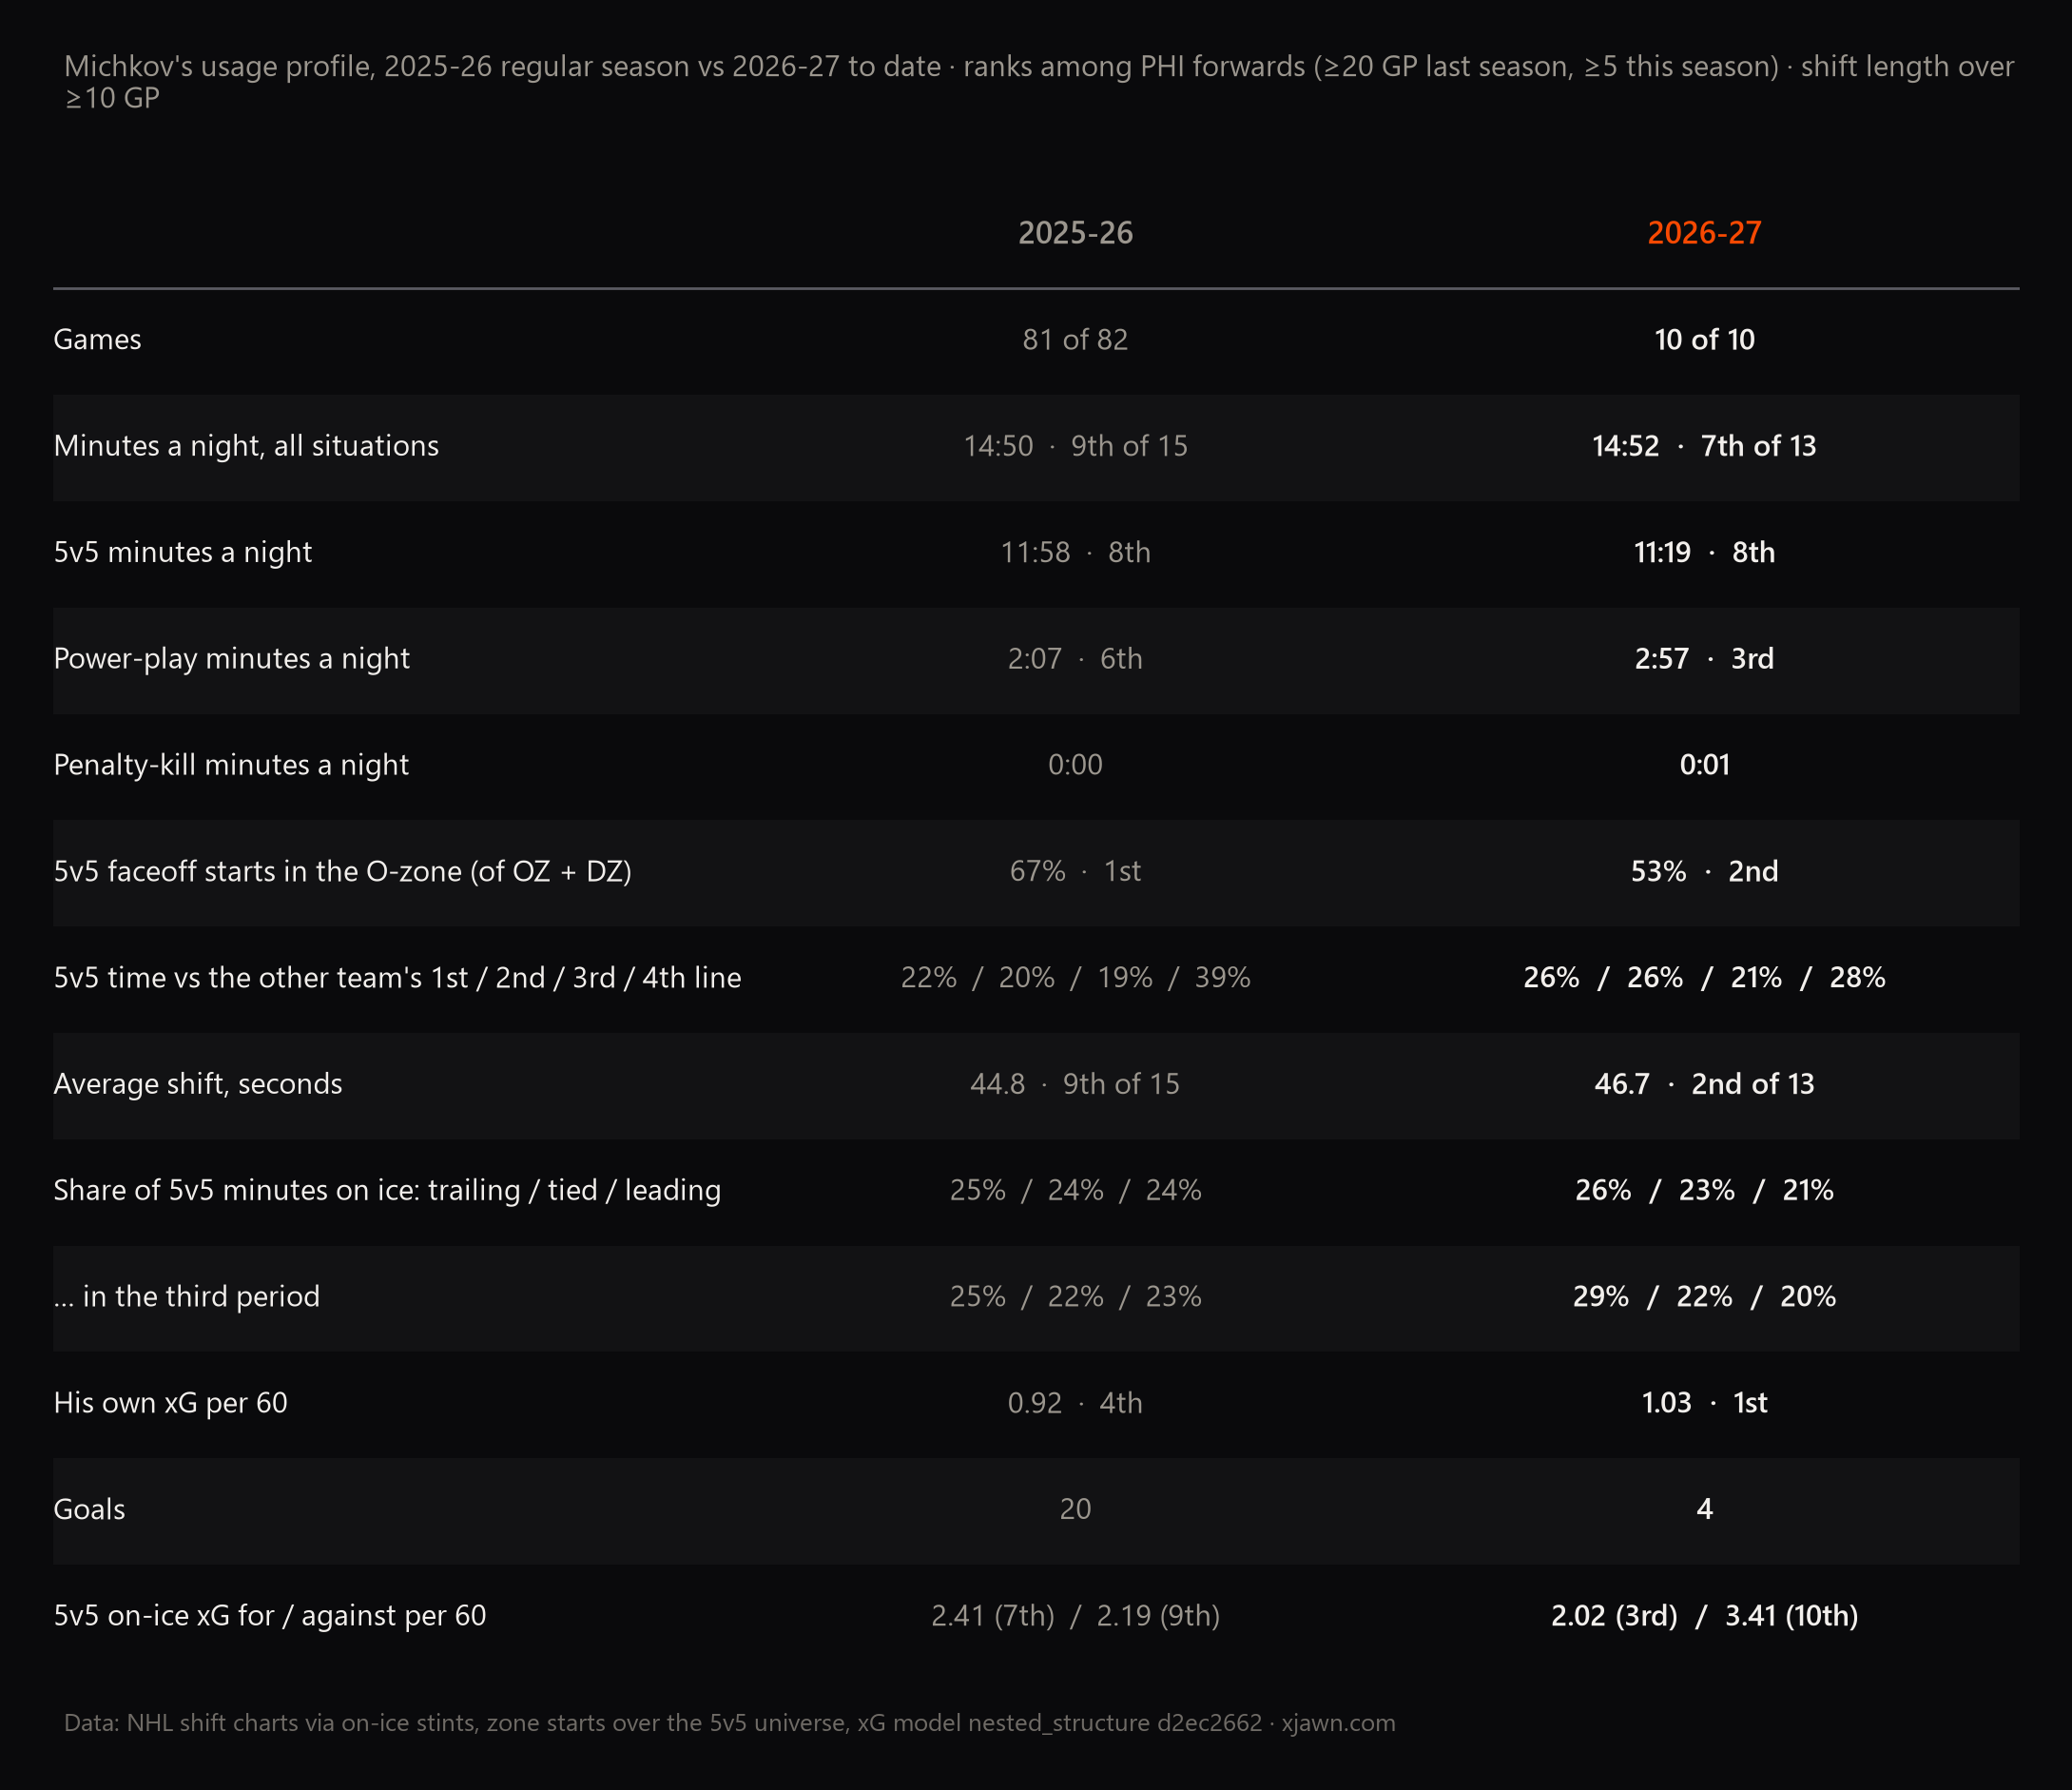
5v5: 11:19 a night and 8th of 13 this year; 11:58 and 8th of 15 last year. Power play: up, from 2:07 to 2:57. Penalty kill: none, both years. The job is the job.
What changed is the shelter. Last year 67% of his zone starts were offensive, 1st on the team by a distance, and 39% of his 5v5 time came against fourth lines, more than any other Flyers forward. This year it is 53% offensive starts and 28% against fourth lines. The shelter came off. What replaced it is an ordinary middle-of-the-roster matchup, not a hard one.
The shift-length thing
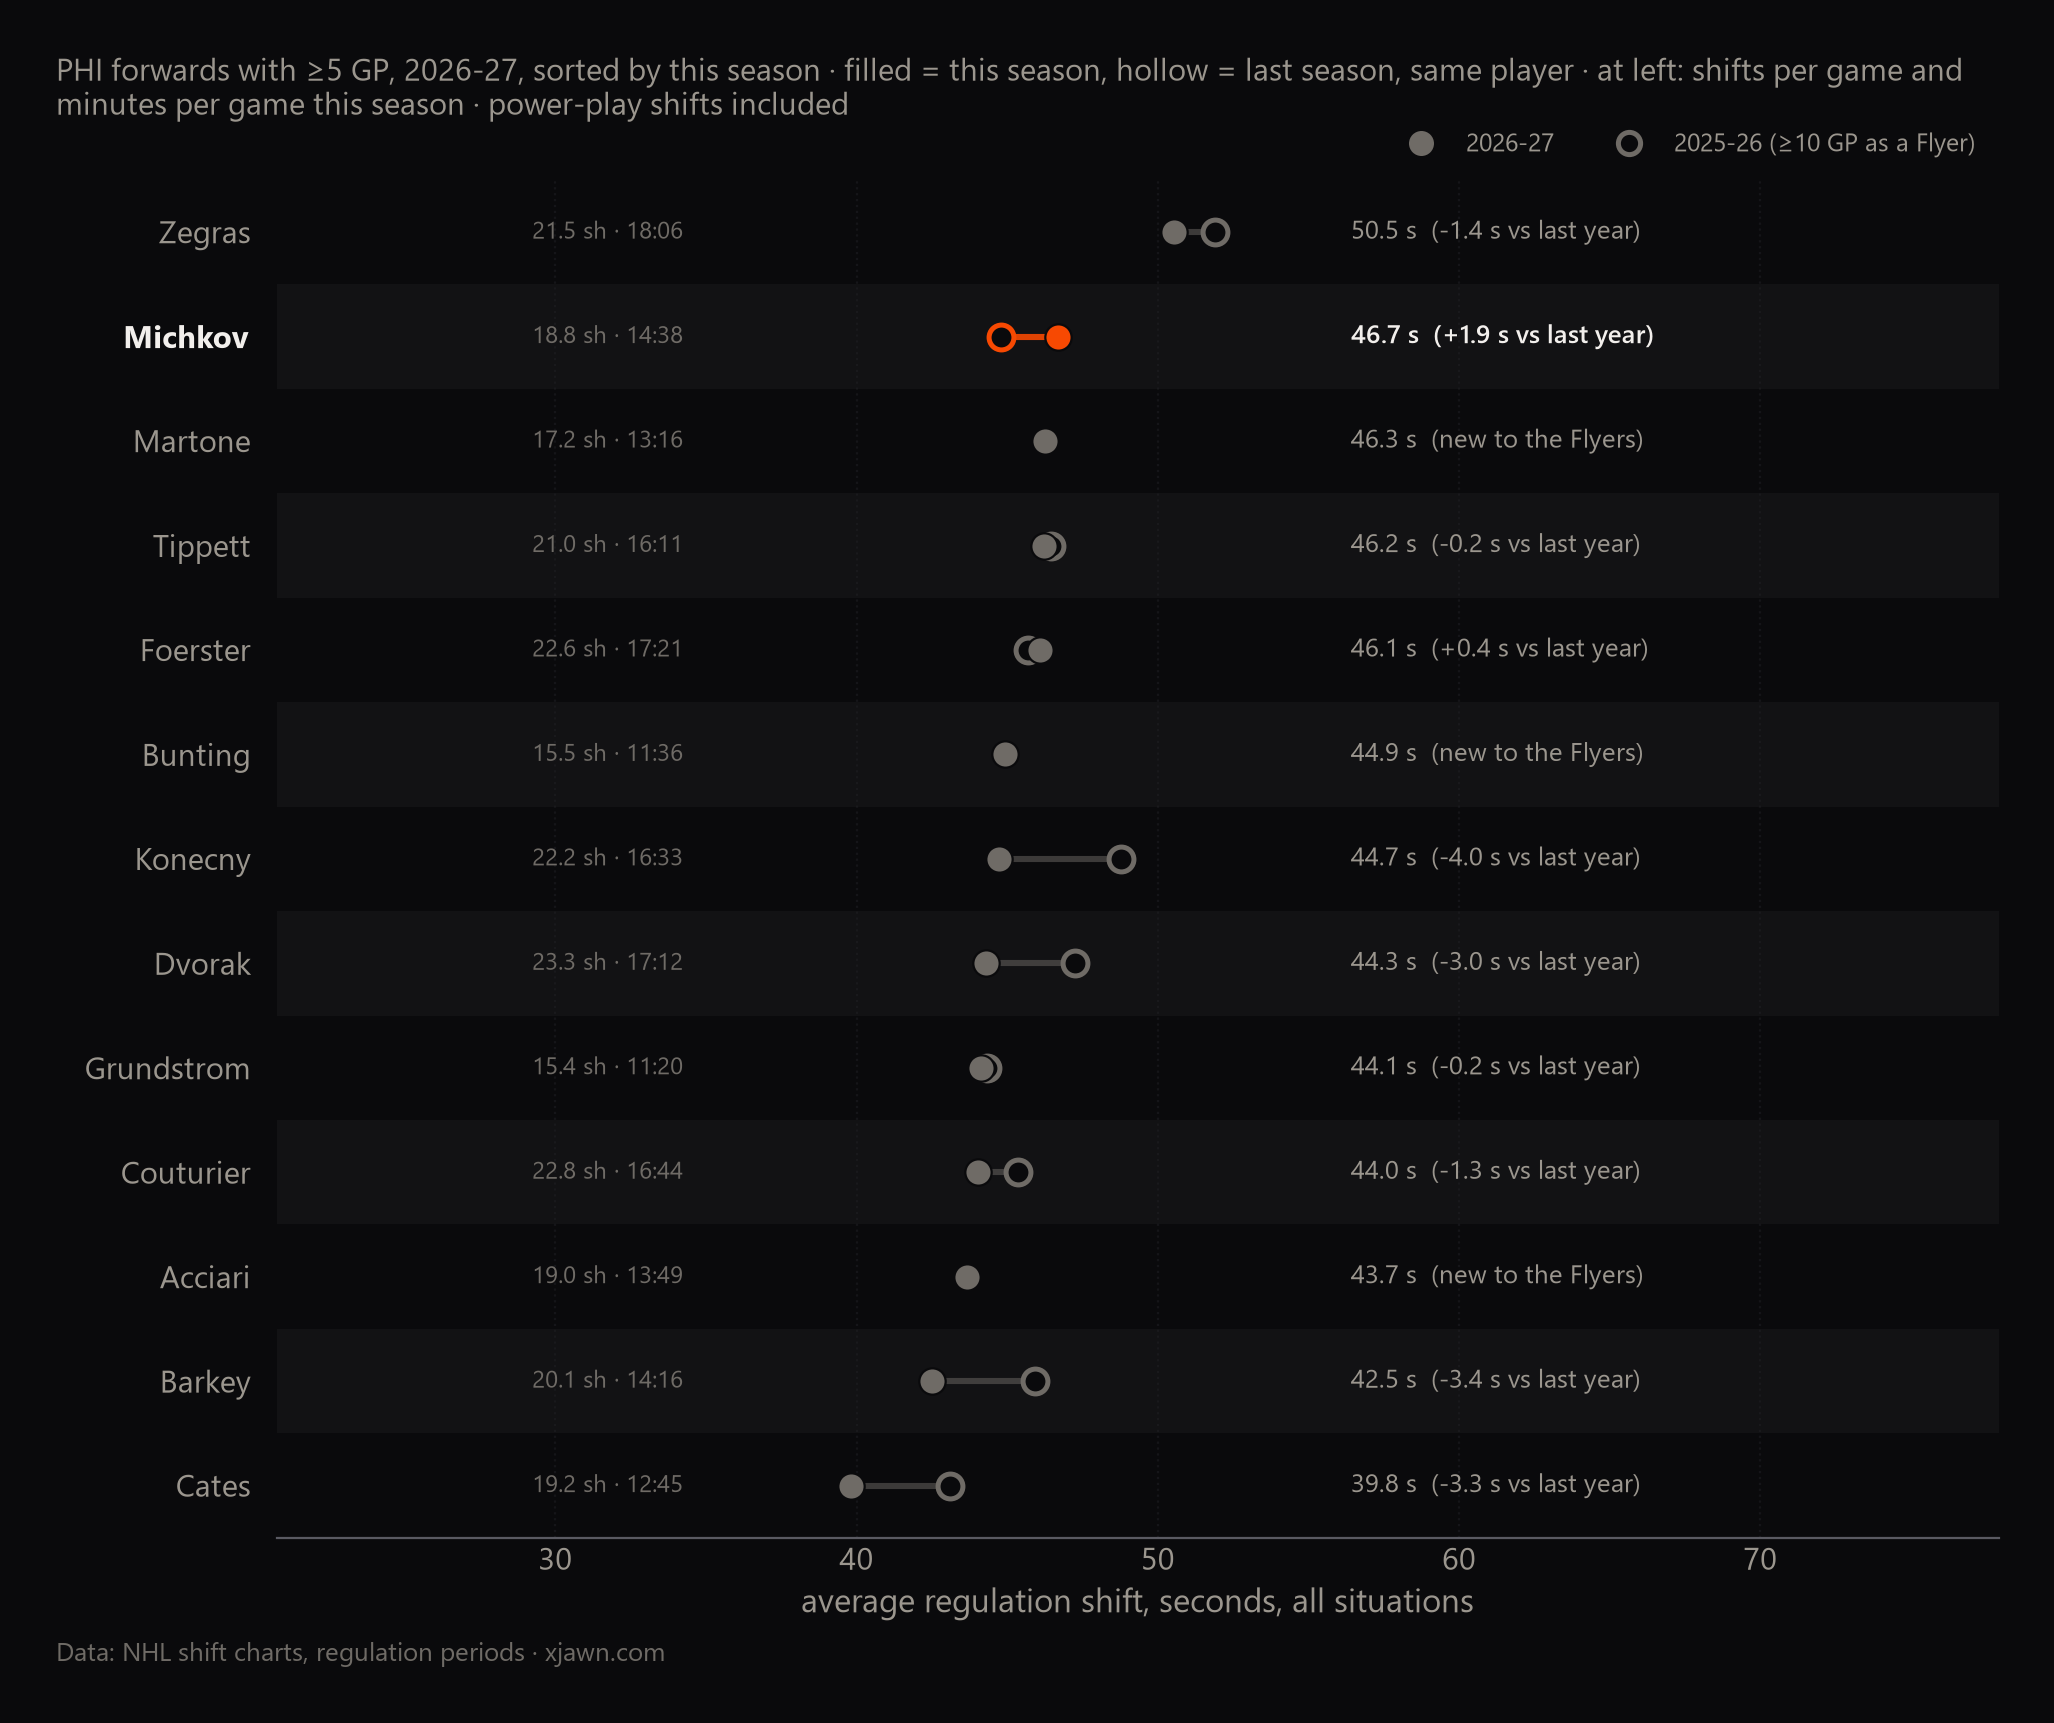
Last year's story was that his shifts ran long. This year they run longer: 47 seconds on average, 2nd-longest of 13 Flyers forwards, up from 45 (9th of 17) last year. He is one of three forwards whose shifts got longer; most of the roster's got shorter. His minutes a night are the same both years (14.6), so it is fewer, longer shifts: 18.8 a game, was 19.5. Whether that is the player stretching shifts or the staff lengthening them, a shift chart cannot say. His power-play share is part of the reason a shift runs long, and it is not split out here.
The third period, and the score
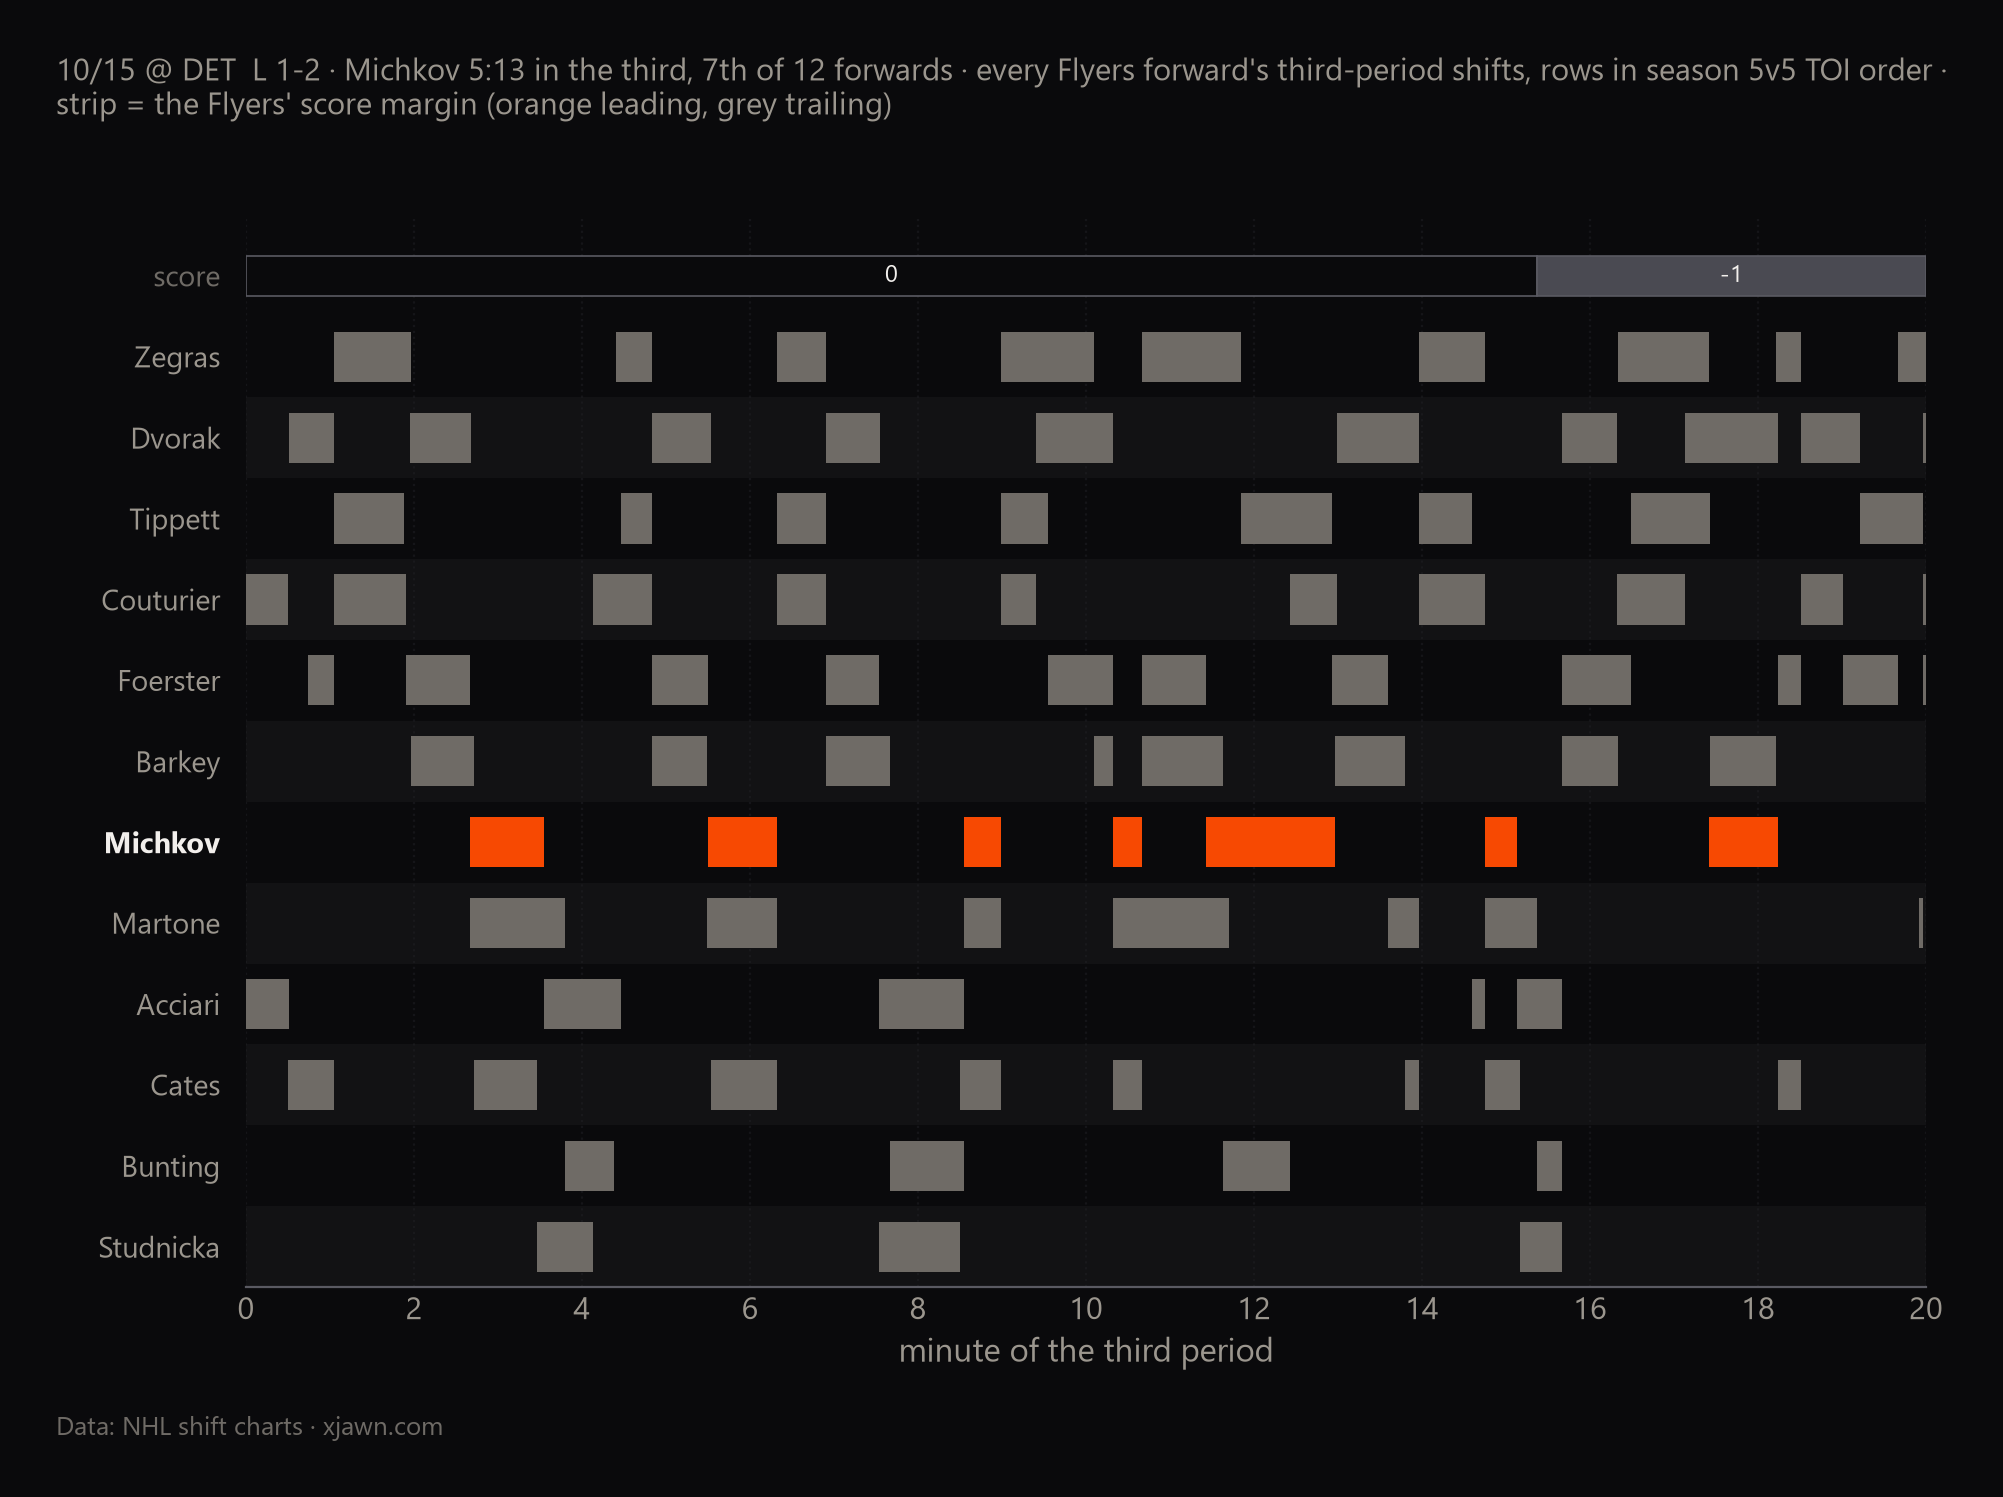
The third period does not change his usage: 8th of 13 in 5v5 minutes over the whole game, 7th in the third, behind the same forwards.
The score is what moves him. Chasing a game in the third, he is on the ice for 29% of the Flyers' 5v5 minutes, 2nd among forwards. Tied or leading, about 20%, 7th. Last year it was 25% whatever the score. The chase role is new, and it is the trend to watch. The leading sample is 23 minutes of hockey, so it is a description of October, not a tendency yet.
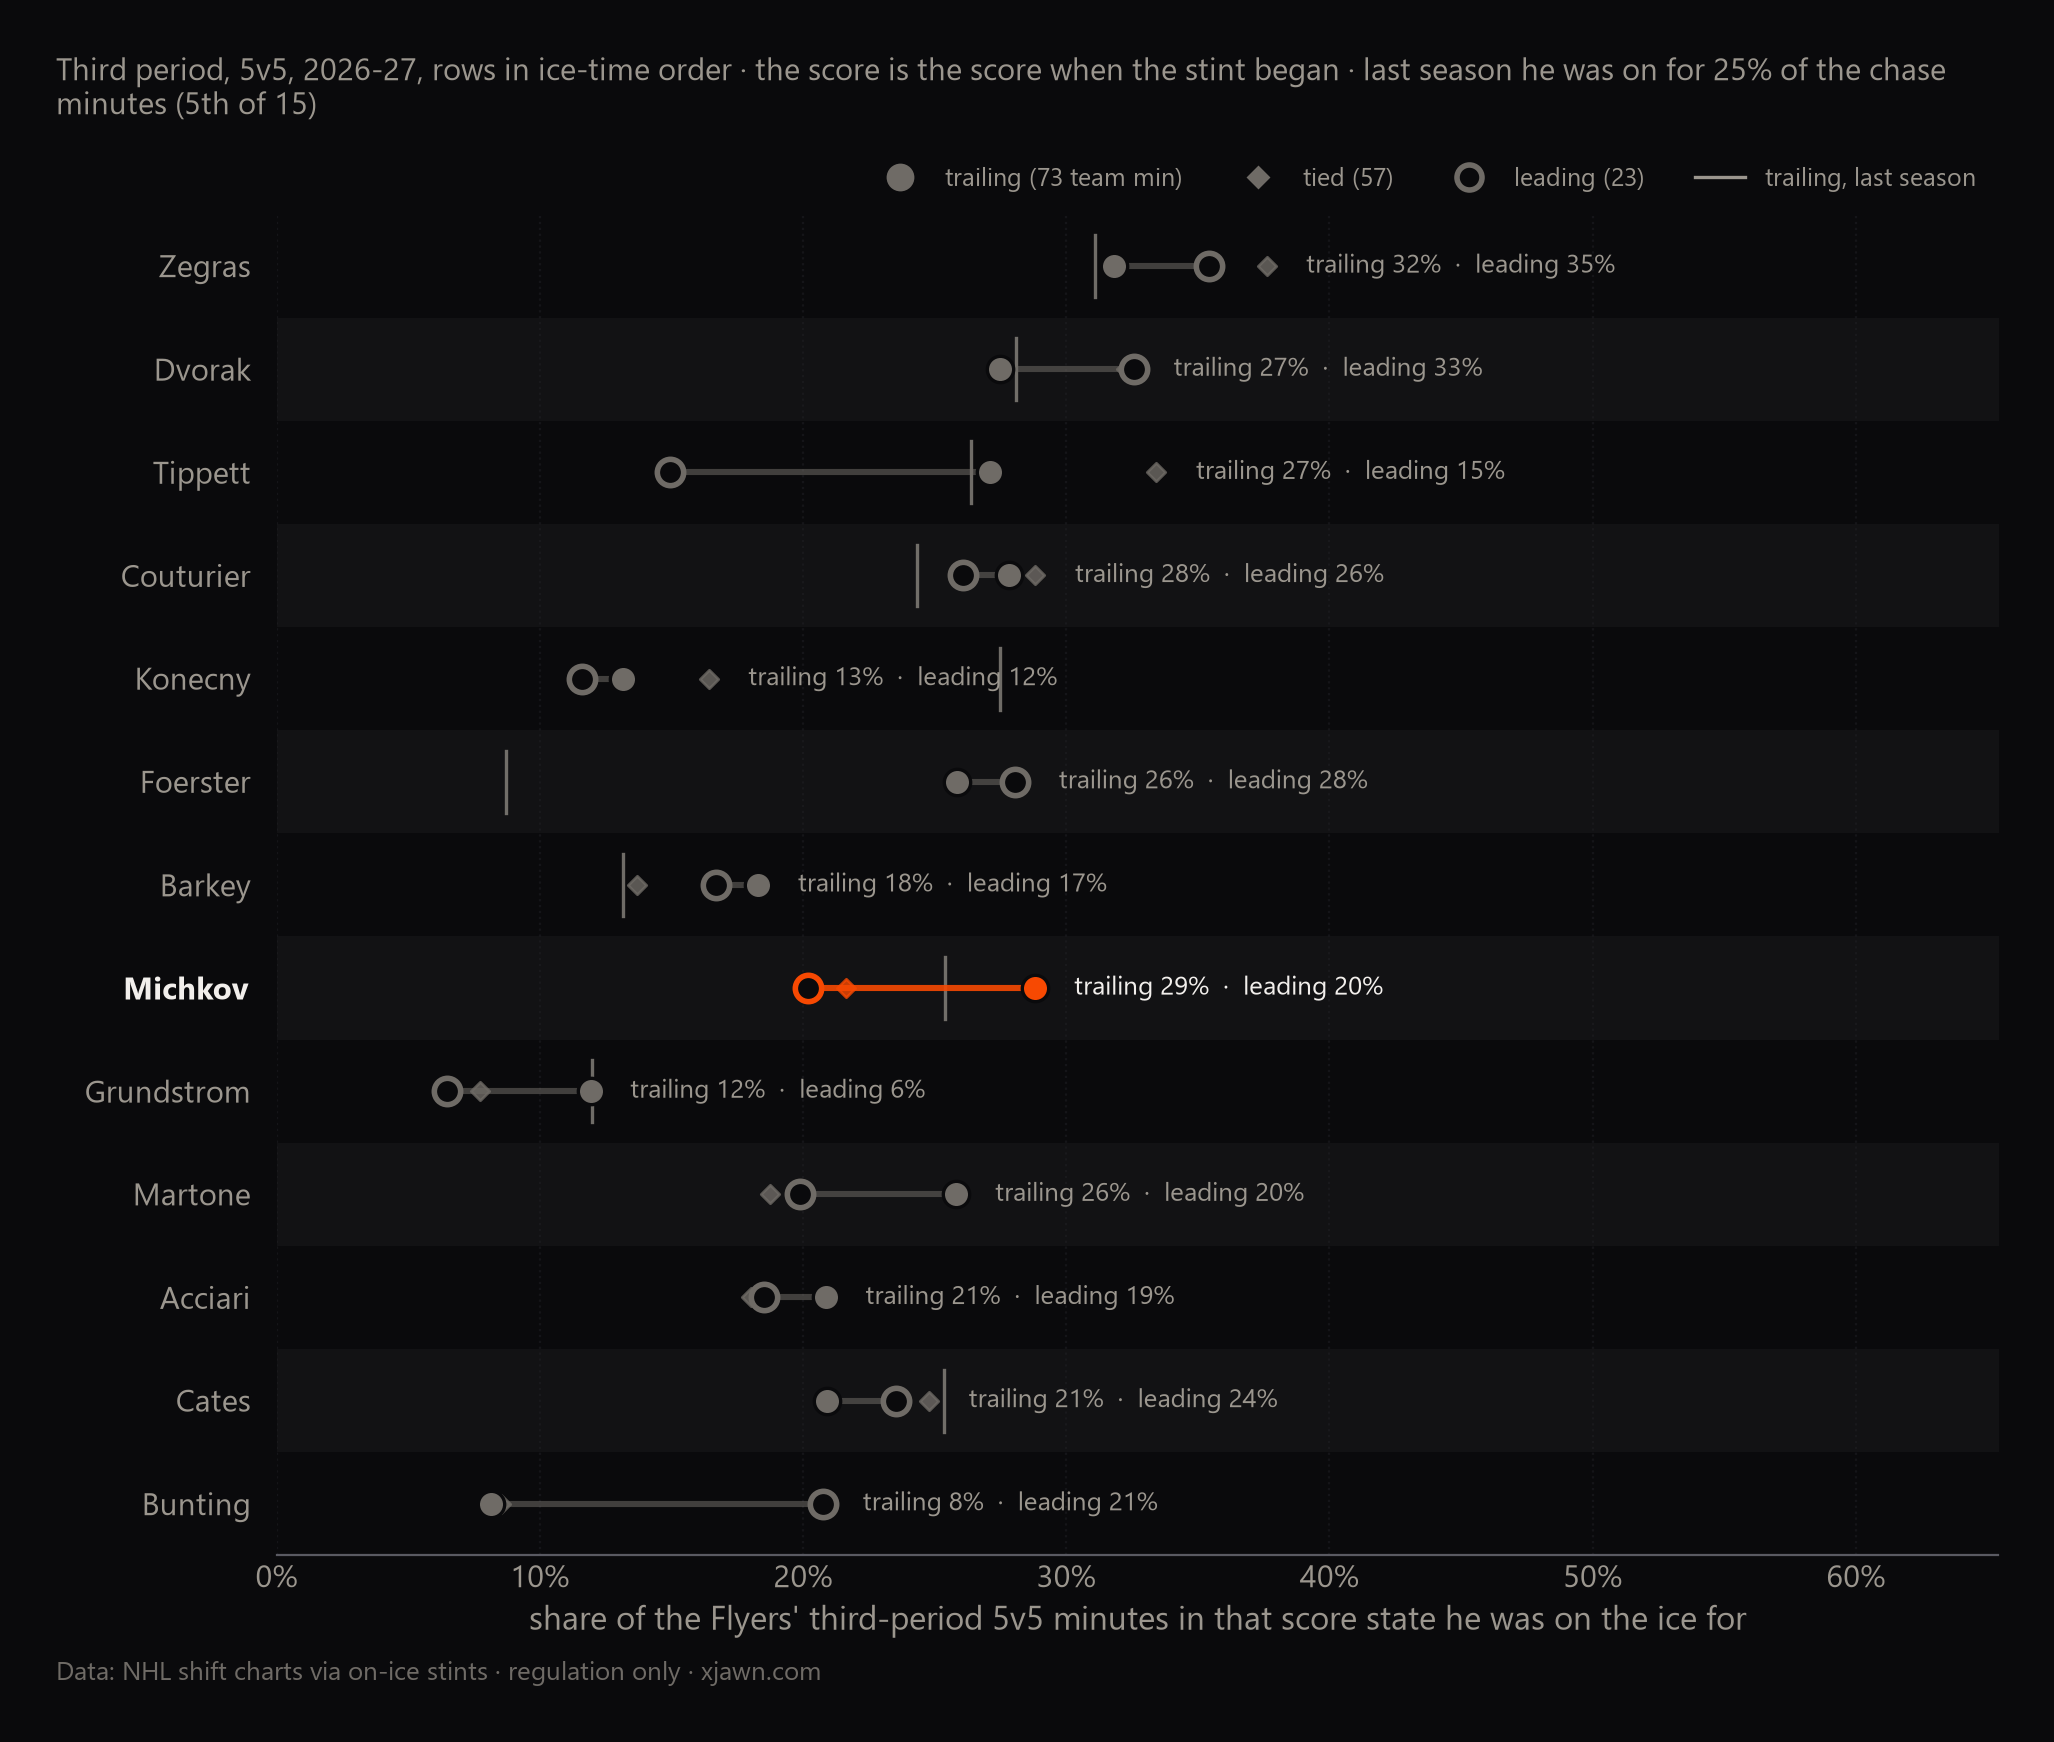
You have to wonder if it is the same thinking that produced that third period in Detroit. Tied for fifteen minutes, he took seven shifts, one of them a ninety-second double. After Detroit scored with 4:40 left he took one shift, while Zegras, Tippett, Couturier and Foerster closed it out.
Related, and for you to interpret
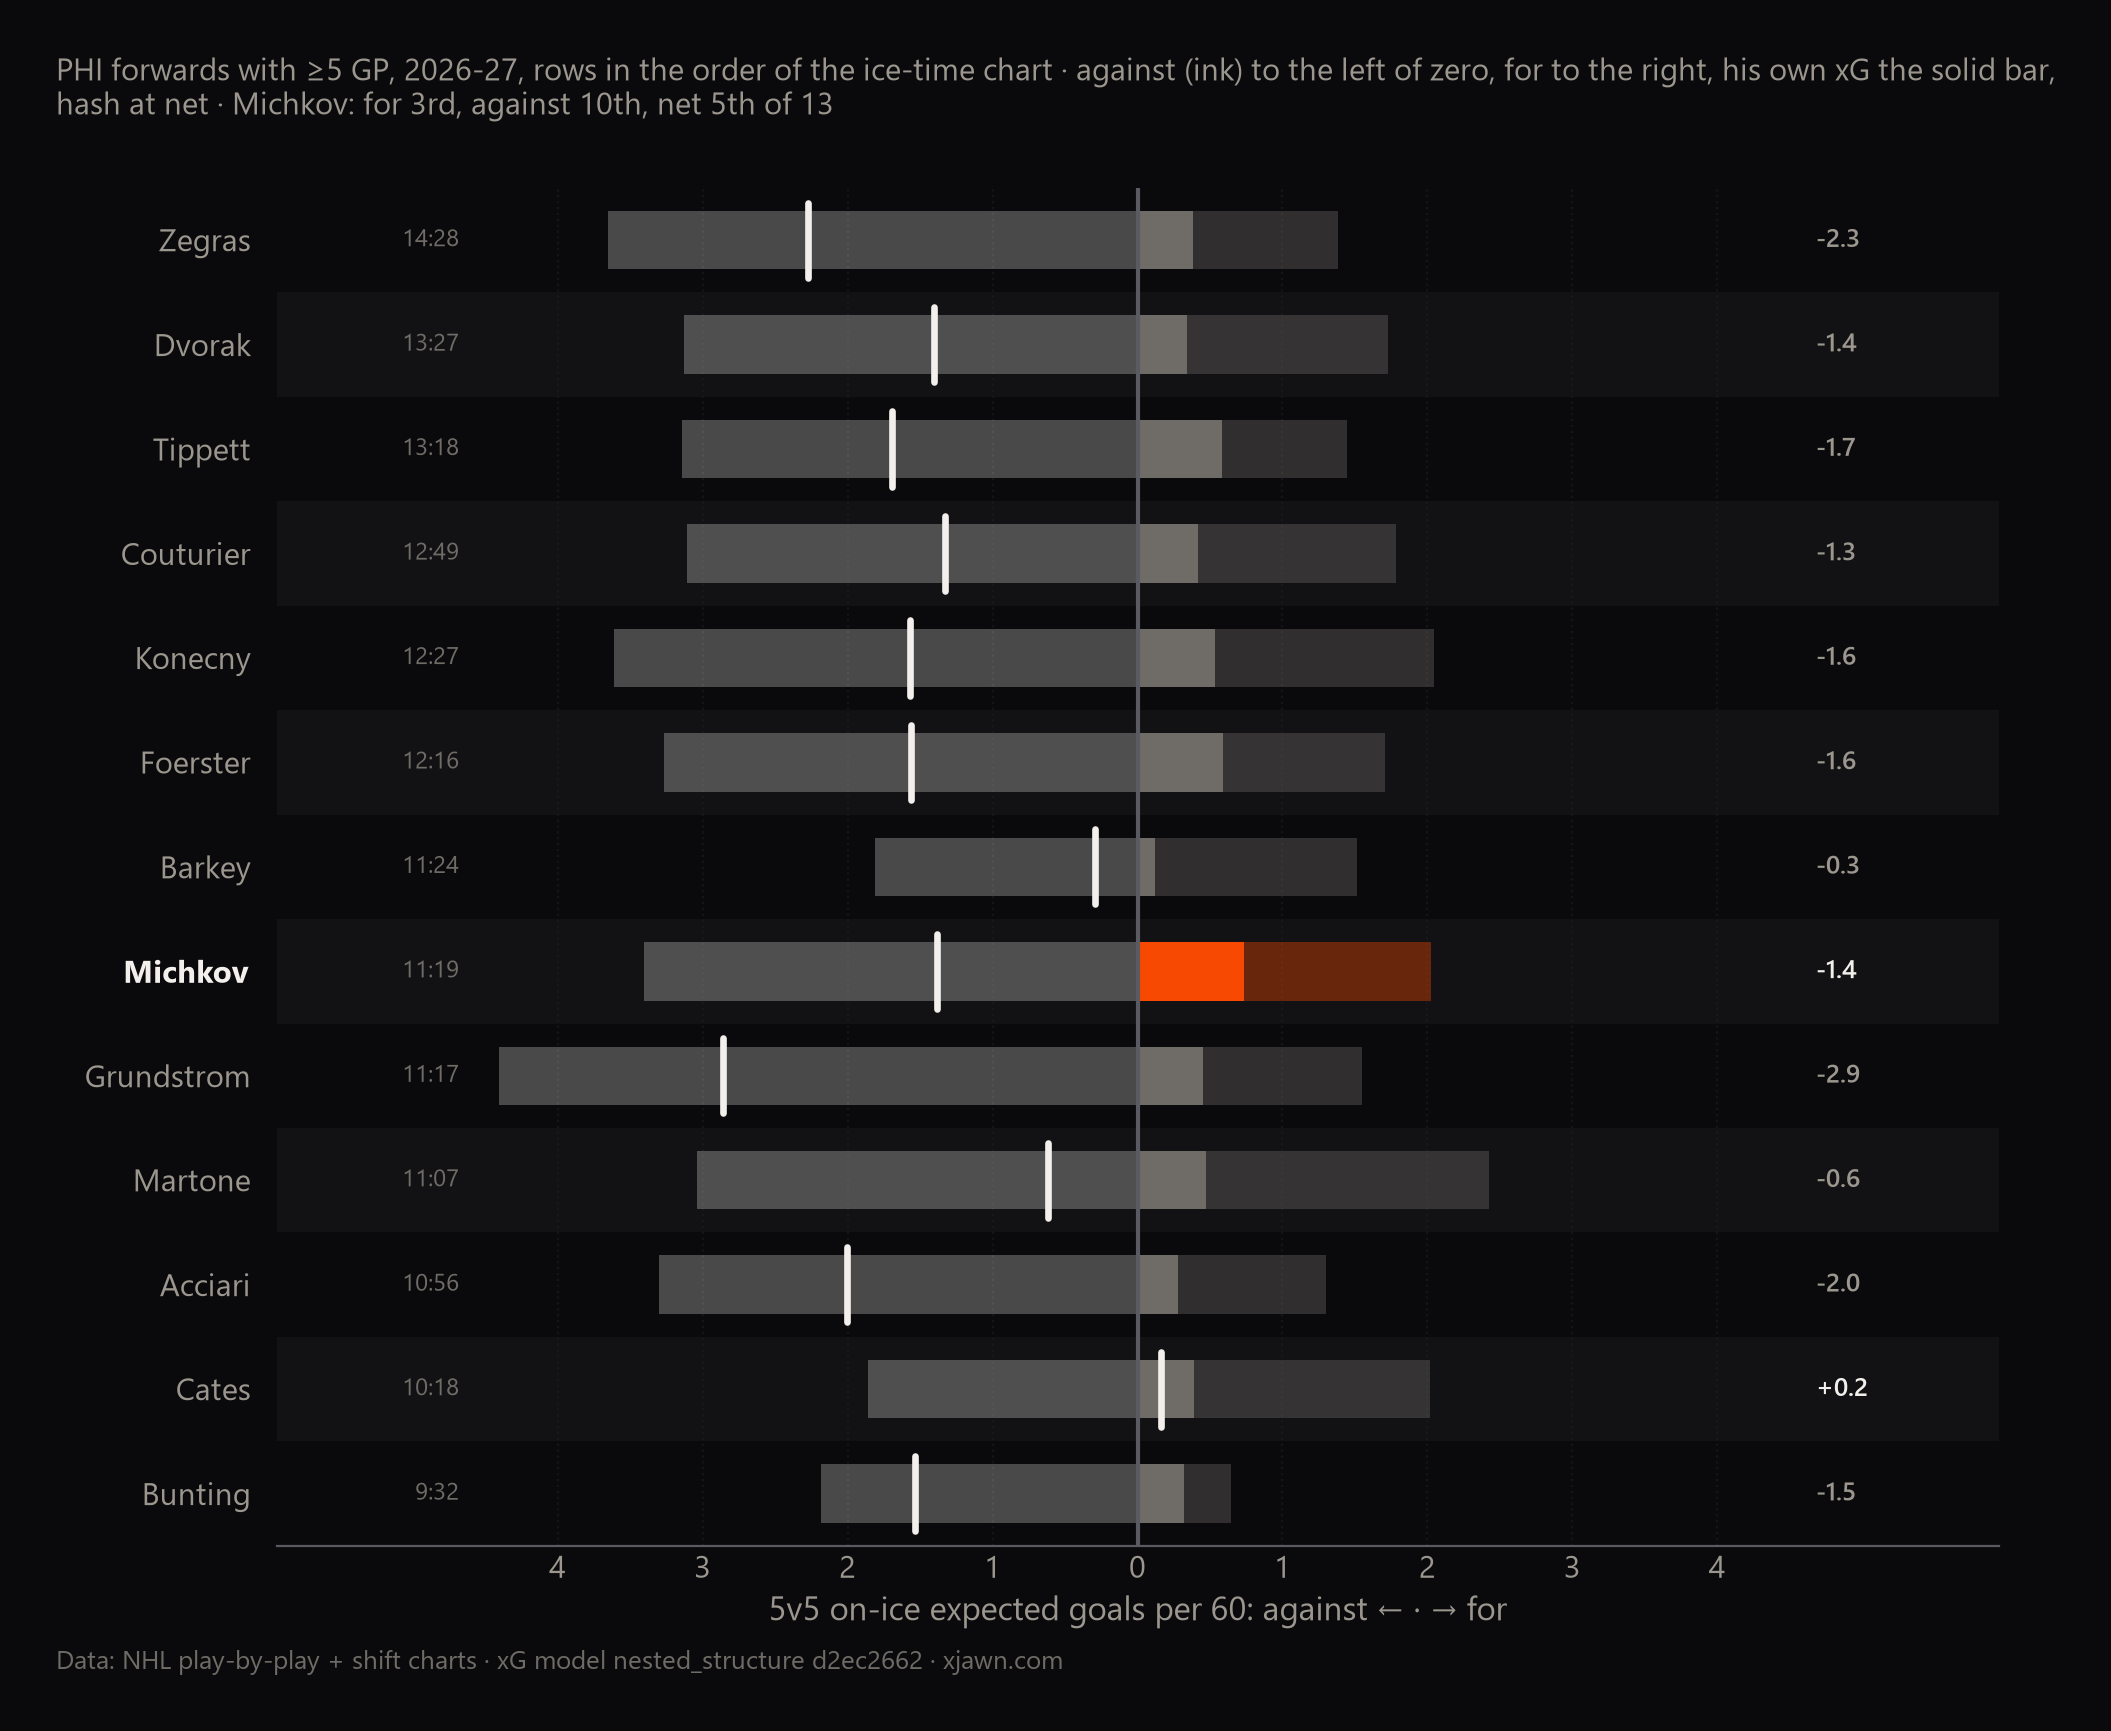
Ten games into a season like this, people will see what they want in a player's on-ice numbers, so here they are without a verdict. With Michkov on the ice at 5v5 the Flyers create 2.02 expected goals per 60 (3rd among the forwards) and allow 3.41 (10th). His own shooting is 0.73 of the 2.02, 1st on the team. Only Cates is above water.
Random thoughts
- Ten games. Everything here describes October 2026. The chase read rests on 23 minutes of leading hockey and will be re-run at 25 games.
- His individual xG per 60 leads the team (1.03, Zegras next at 0.95), but that is a shooter's number, not a creator's: his attempt rate is mid-pack and his xG per attempt is second on the team. It is also the lowest team-leading rate in the league (the median team leader is around 1.54), so "best forward" is a Flyers-scale claim, and this post does not make it.
- "Forward" is the registered position. None of the Flyers' dressed skaters changed position across these games.
- Score state is the score when a shift segment began. A segment that spans a goal is credited to the state it started in.
- The competition split uses each opposing forward's rank on his own team by 5v5 ice time, three to a line. It is a measure of who the coach sent out, not of how good they are. A model-based version (opponents' RAPM) ranks Michkov in the same place, 9th of 13.
The player page updates nightly: Matvei Michkov. The Flyers' page is here.