The NHL changed how it keeps score. Here's how to catch it.
The league has changed how it records games several times without saying so. Each change shows up in the data overnight and in every building at once. Most are harmless to a model that knows about them. One kind is not: when how a shot is recorded depends on whether it went in.
TL;DR. The NHL has changed how it records games several times without saying so, and you can catch each change in the data: it arrives in one night and lands the same in every building. Most of the changes are harmless once a model knows about them. One kind is not: when how a shot is recorded depends on whether it went in, the model learns the scorekeeper instead of the hockey.
The scorekeeper used to be part of the data
Every event in the play-by-play was typed in by a person in the press box, one crew per building, and analysts have known for almost 20 years that the crew leaves fingerprints. Alan Ryder showed in 2007 that Madison Square Garden recorded shots far closer to the net than other rinks. Gabriel Desjardins found in 2009 that the home team got 30–40% more of the flattering turnover calls. Michael Schuckers and Brian Macdonald measured every rink's counts in 2014: some buildings logged more than ten times the giveaways of others, while shots on goal barely varied.
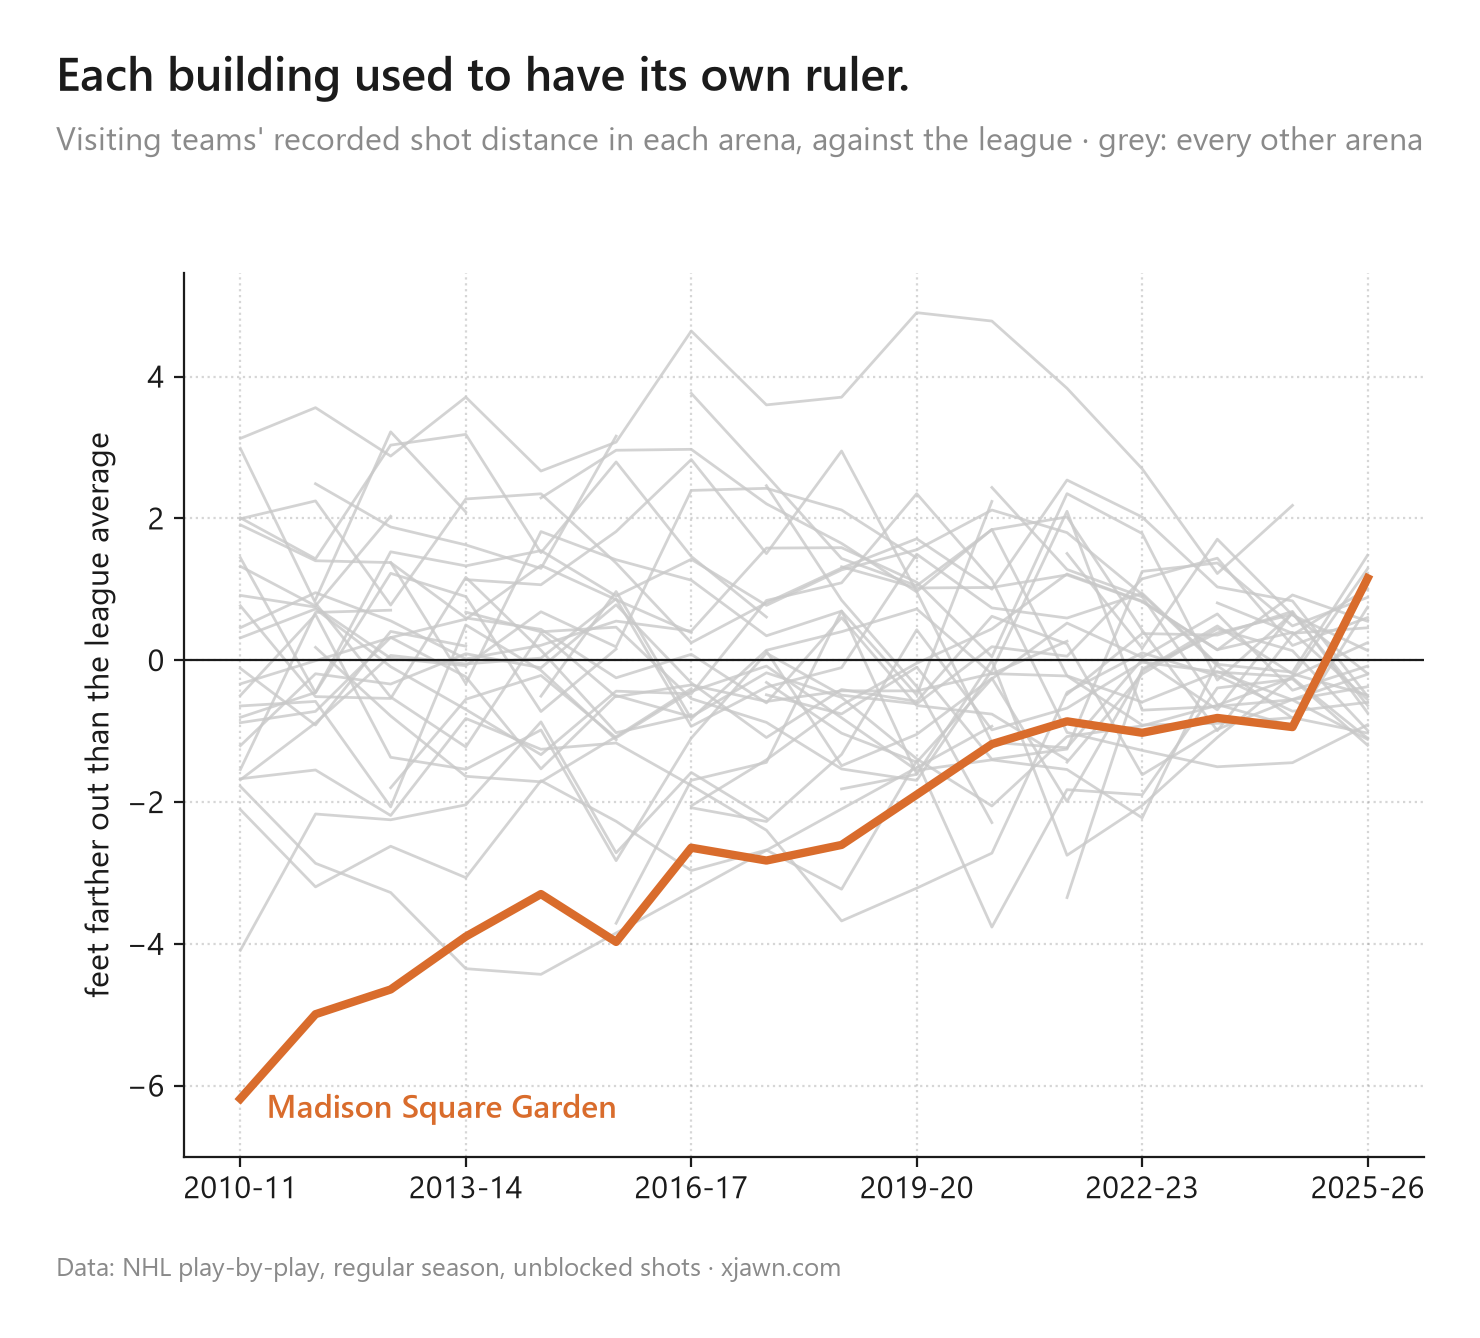
In 2010-11 the Garden put visitors' shots 6 feet closer than the league did. The typical arena was off by 1.8 feet in either direction through 2019-20, and since 2023-24 by 0.8: the league's puck tracking has taken over the locations. The NHL has never said so, but every shot now sits within about two feet of where the tracked puck was.
How to catch a change nobody announced
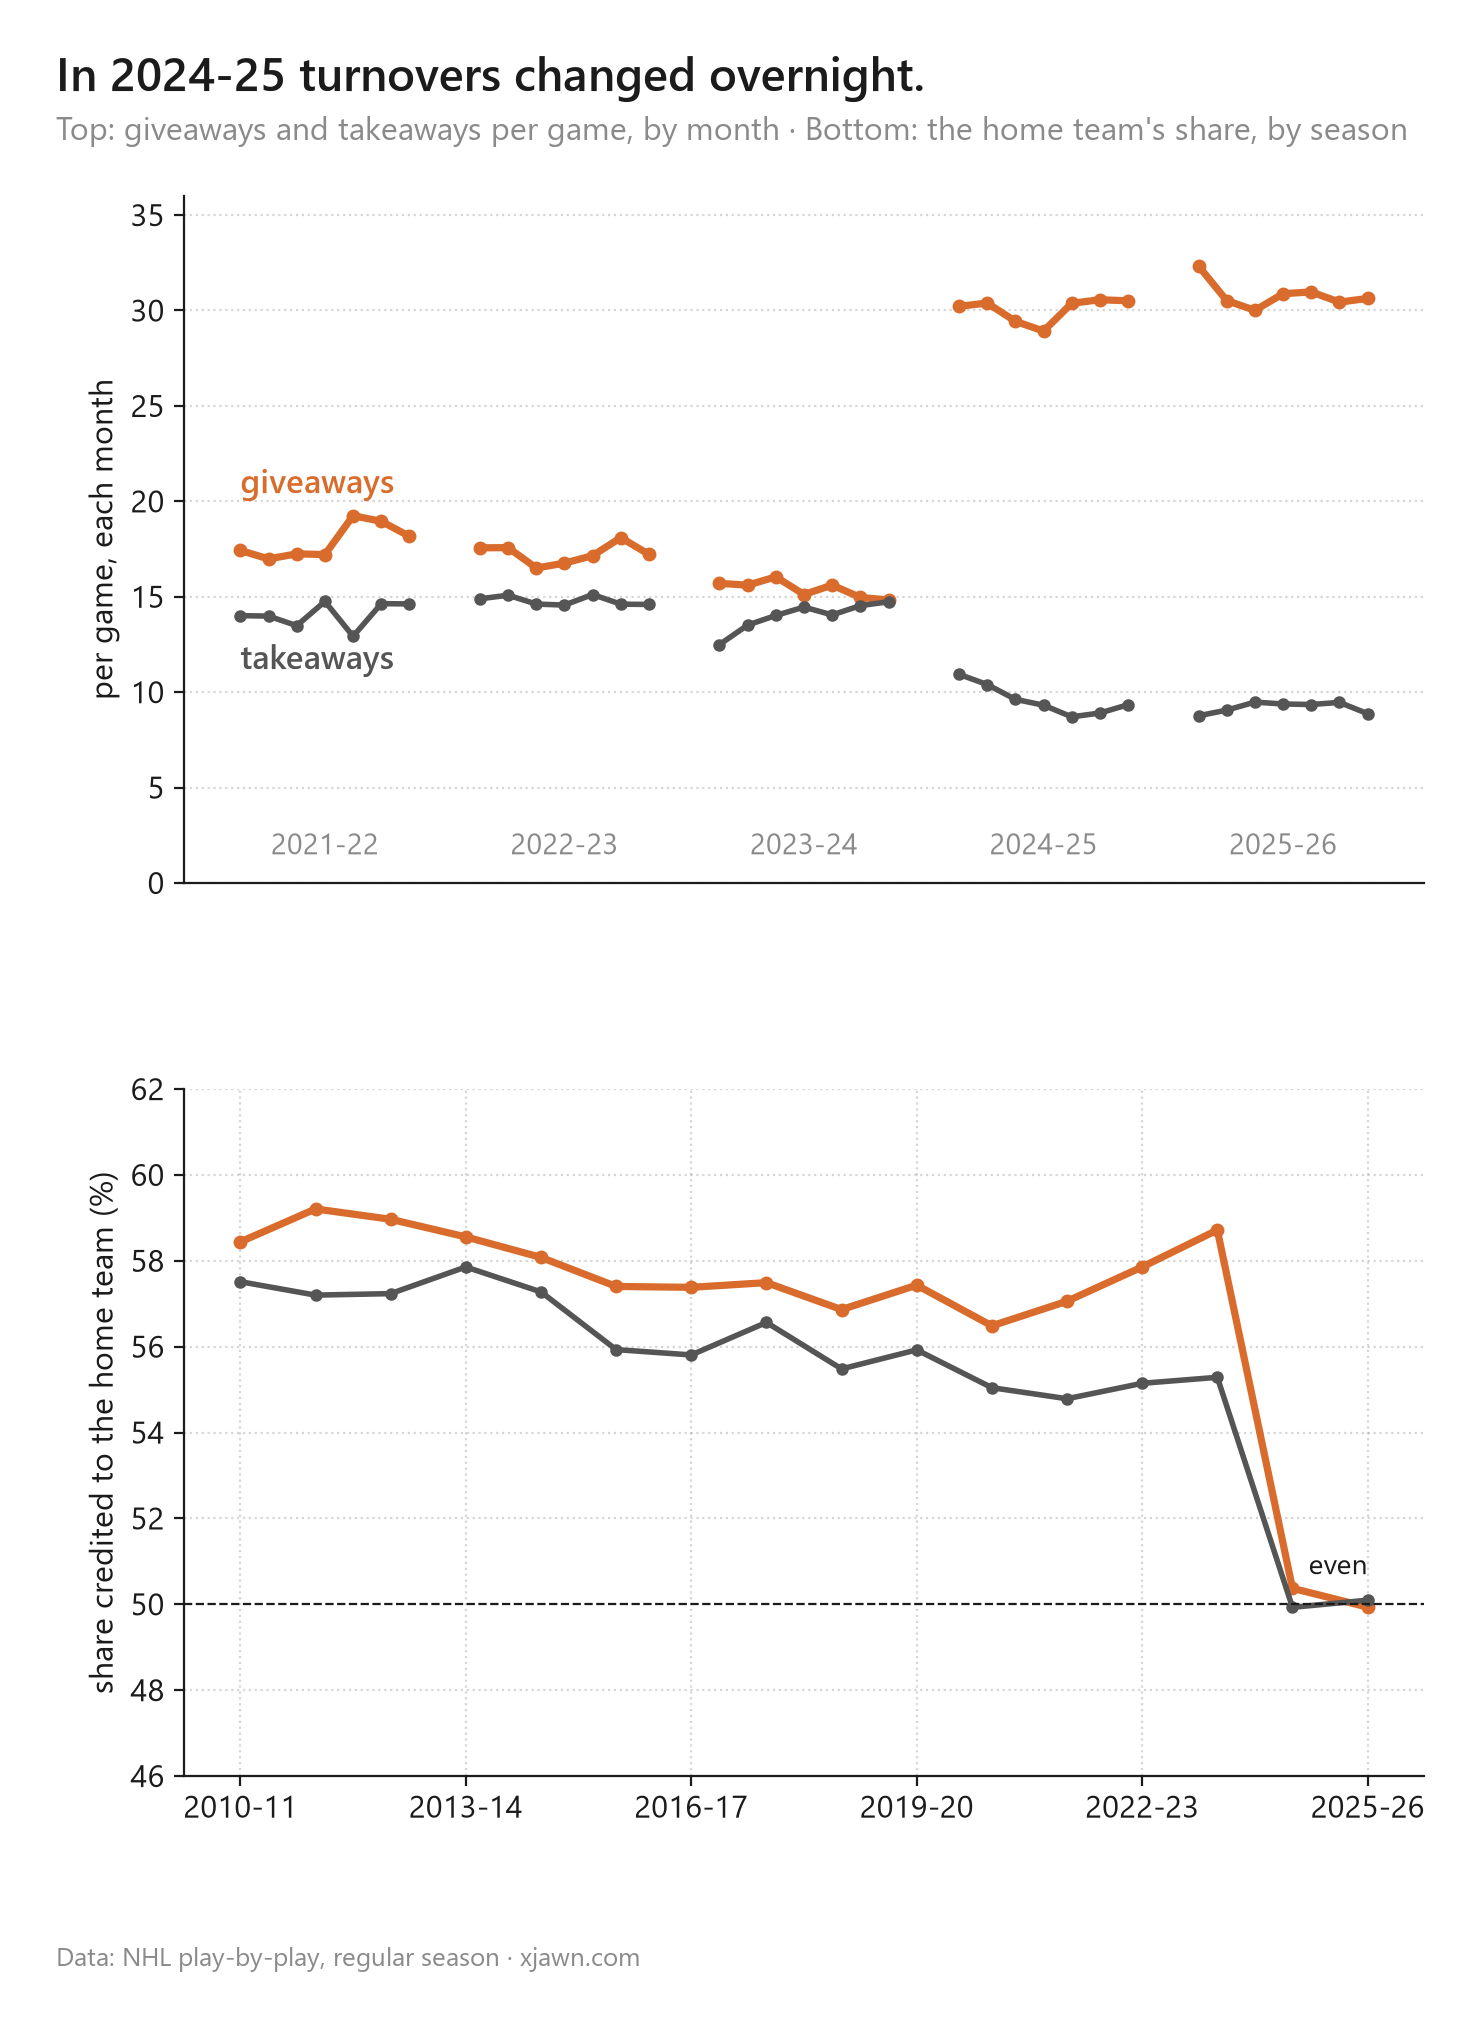
Hockey changes slowly: teams copy a system over a season or two, and the numbers drift. A change in recording is a step at a season opener, flat inside the season, and the same in every building. Turnovers in 2024-25 (the chart at the top) are the cleanest example. Aaron Knodell noted the jump in November 2025; here is what it is.
- Overnight. Giveaways went from 15.4 a game in 2023-24 to 30.0 in 2024-25. Takeaways fell from 14.0 to 9.6.
- The same everywhere. How much rinks differed in giveaways a game fell from 5.0 to 2.4 (one standard deviation across arenas).
- The home lean is gone. The home team got 58.7% of giveaways in 2023-24 and 50.4% in 2024-25. The bias Desjardins wrote about in 2009 ended in one night.
It is a new definition, not just more counting: a defender stripping a puck carrier used to be the defender's takeaway, and now it is more often the carrier's giveaway.
More shots, same goals
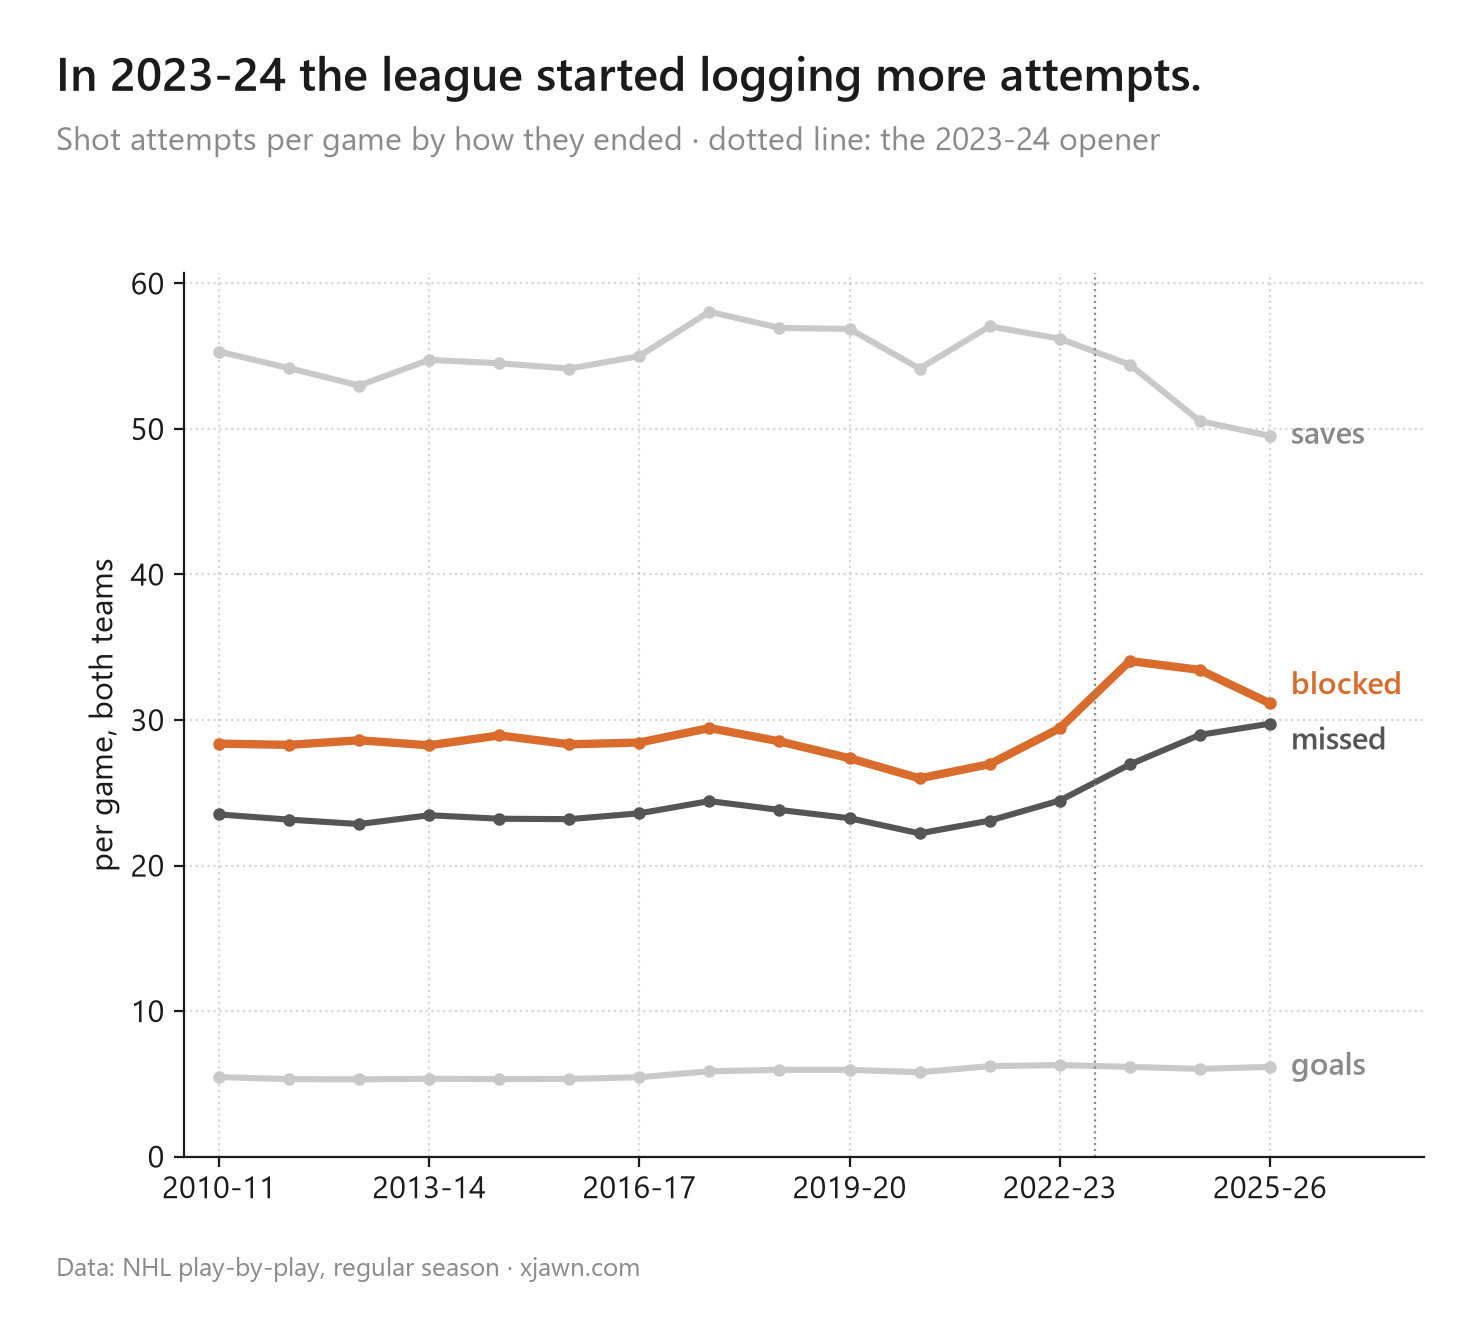
The same signature shows up a season earlier. From 2022-23 to 2023-24 blocked shots went from 29.4 to 34.1 a game and missed shots from 24.5 to 26.9. Goals did not move. David Johnson and Prashanth Iyer both showed the share of attempts reaching the net falling over these seasons. Rebounds, by our count, went from 7,786 in 2019-20 to 14,787 in 2023-24, while rebound goals stayed flat. The scrambles were always there; now the second and third whacks at the puck get written down. Why 2022-23 sits halfway is the twist further down.
Harmless, if the model is told
None of this hurts an expected-goals model on its own. If "giveaway" means something new from 2024-25 on, the model can learn the two meanings separately, like switching from inches to centimeters and writing down which you used.
The dangerous kind is when how a shot is recorded depends on whether it went in. A model is built to find anything that separates goals from non-goals. If the recording does that, the model will find it, and it will look like skill.
When does a shot happen?
Every event in the play-by-play carries a time, to the second. For a shot, which second is a choice.
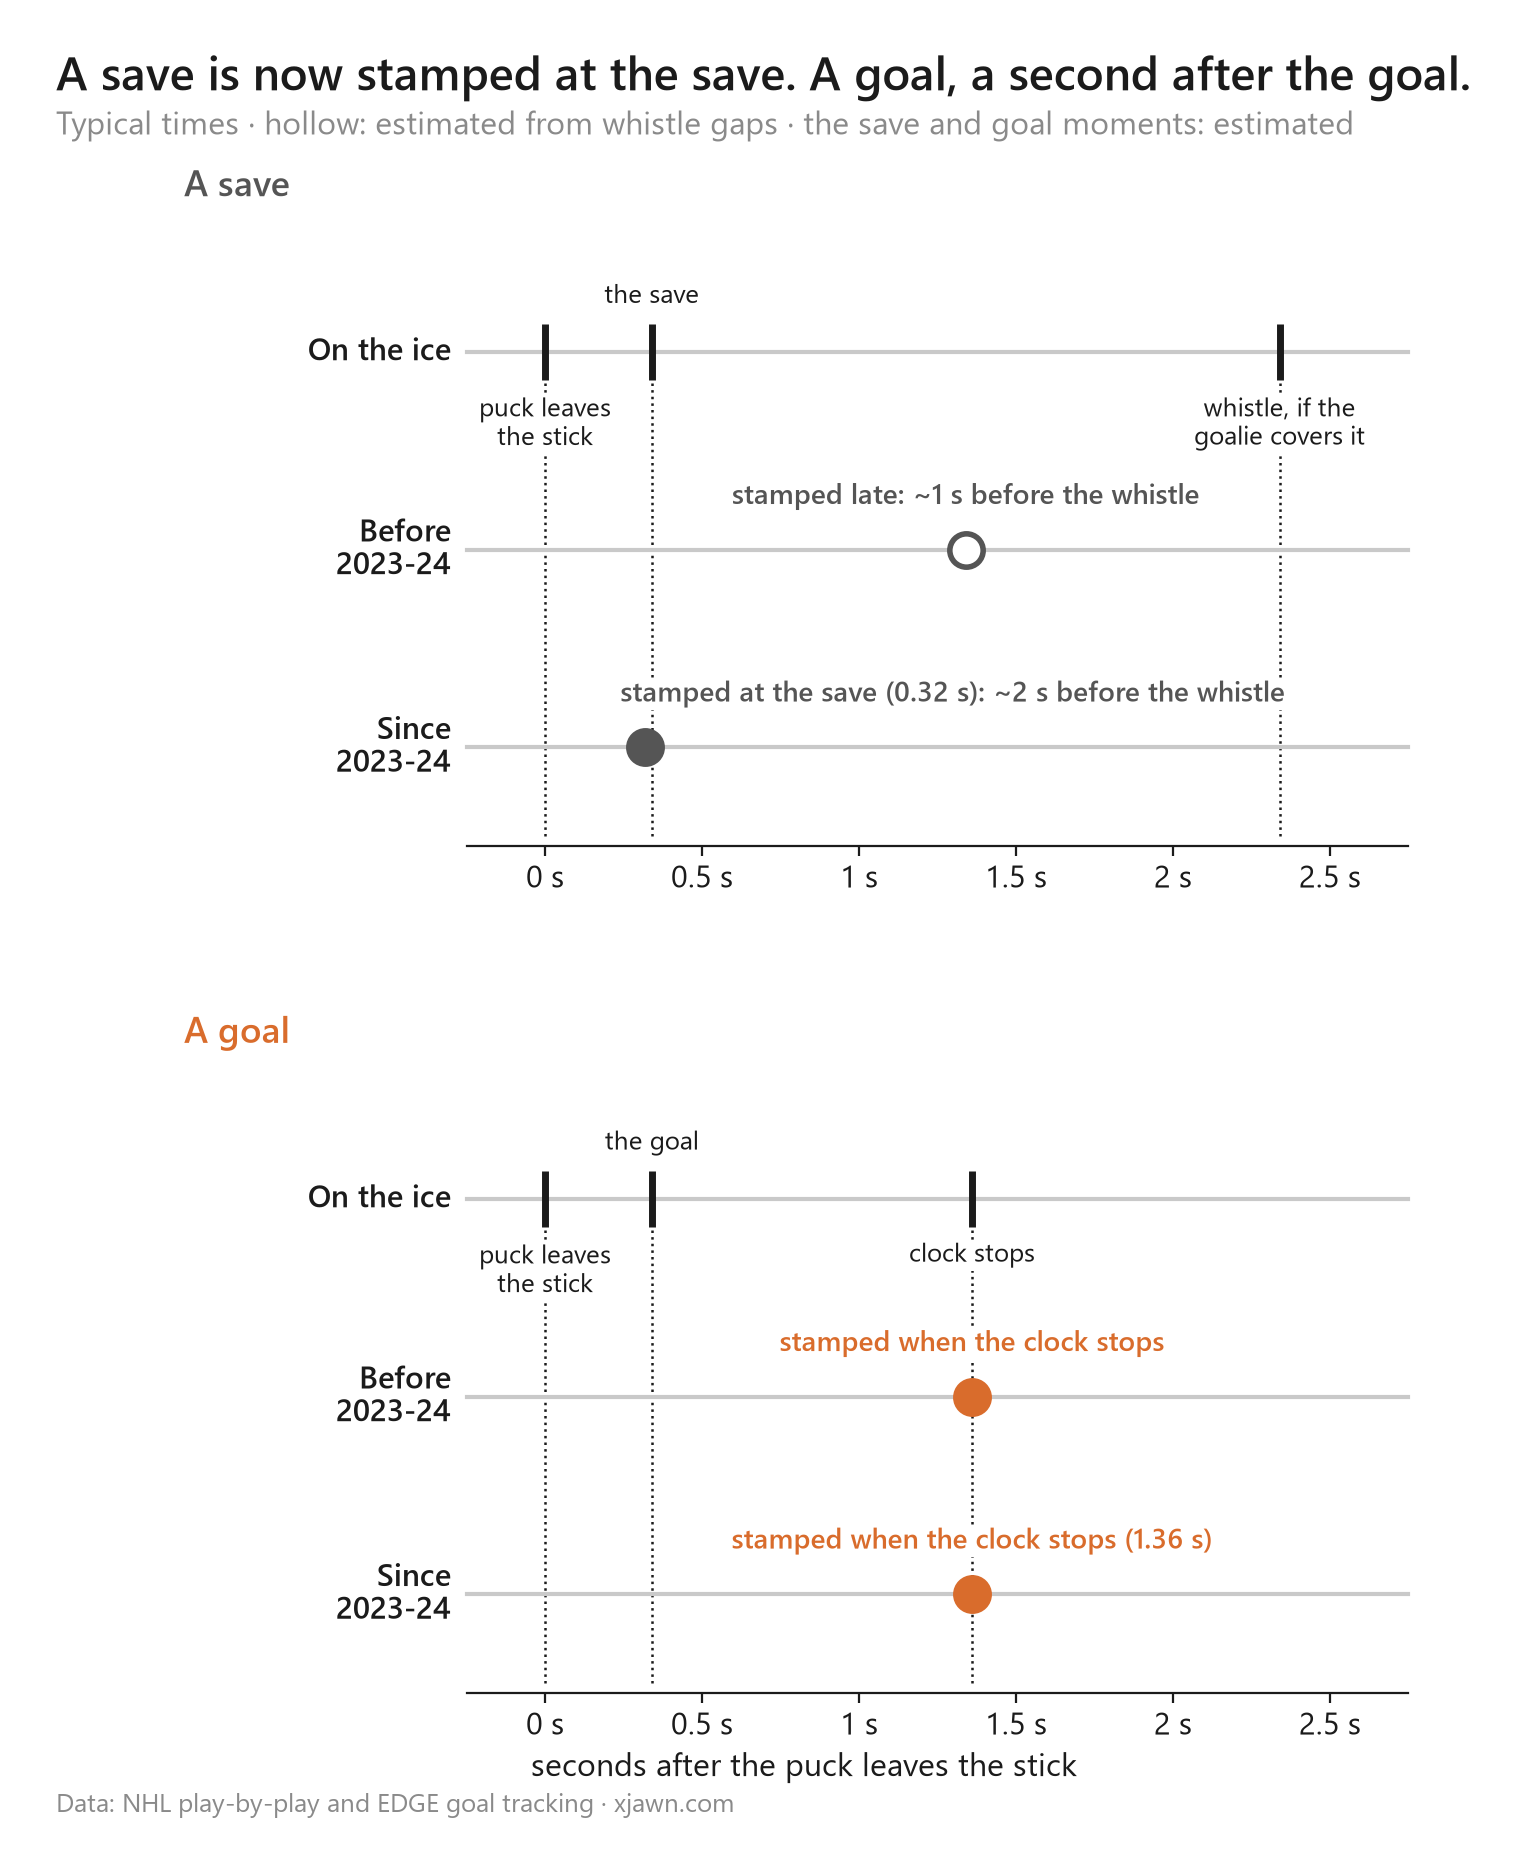
Before tracking, a scorer logged each shot after it happened, and its time landed late. A save and a goal were stamped about equally late, near when play stopped. One check: after a faceoff, the time until a goal and the time until a save were within a fraction of a second of each other (0.3 seconds apart in 2021-22).
Since 2023-24, a saved or missed shot is stamped at almost the moment the puck leaves the stick, about 0.32 seconds after. Only tracking can do that. A goal is still stamped when the clock stops.
The signature
Start with the save in the sketch. When the goalie covers the puck, which happens on about 35% of saves, the whistle comes about 2 seconds after the save.
Under the old rule the save was stamped late, about a second before that whistle. So in the data, a covered save had its whistle within a second 76% of the time (2019-22).
Under the new rule the save is stamped at the save, about two seconds before the whistle. The test compares two kinds of event whose stamp should have changed with one whose stamp should not. If the sketch is right:
- Covered saves: the quick whistle should nearly disappear. The whistle is a fixed moment, about two seconds after the save. Only the stamp moved, from about a second before the whistle to two seconds before it.
- Misses: the same collapse. A miss is sometimes followed by a quick whistle too, when the puck flies out of play or the goalie smothers it. A miss is a shot, so tracking now stamps it at the release as well. If misses collapse too, it was shots that changed, not saves in particular.
- Hits: much less change. A hit is sometimes followed by a quick whistle as well: the puck goes out of play, a penalty is called, a scrum starts. But a hit is not a shot, so there is no release for tracking to stamp, and it should keep its old timing. If hits collapsed too, the change would be about whistles, not shot stamps. Hits are the control.
- A season opener, not a drift. Hockey changes slowly. A recording rule changes in one night.
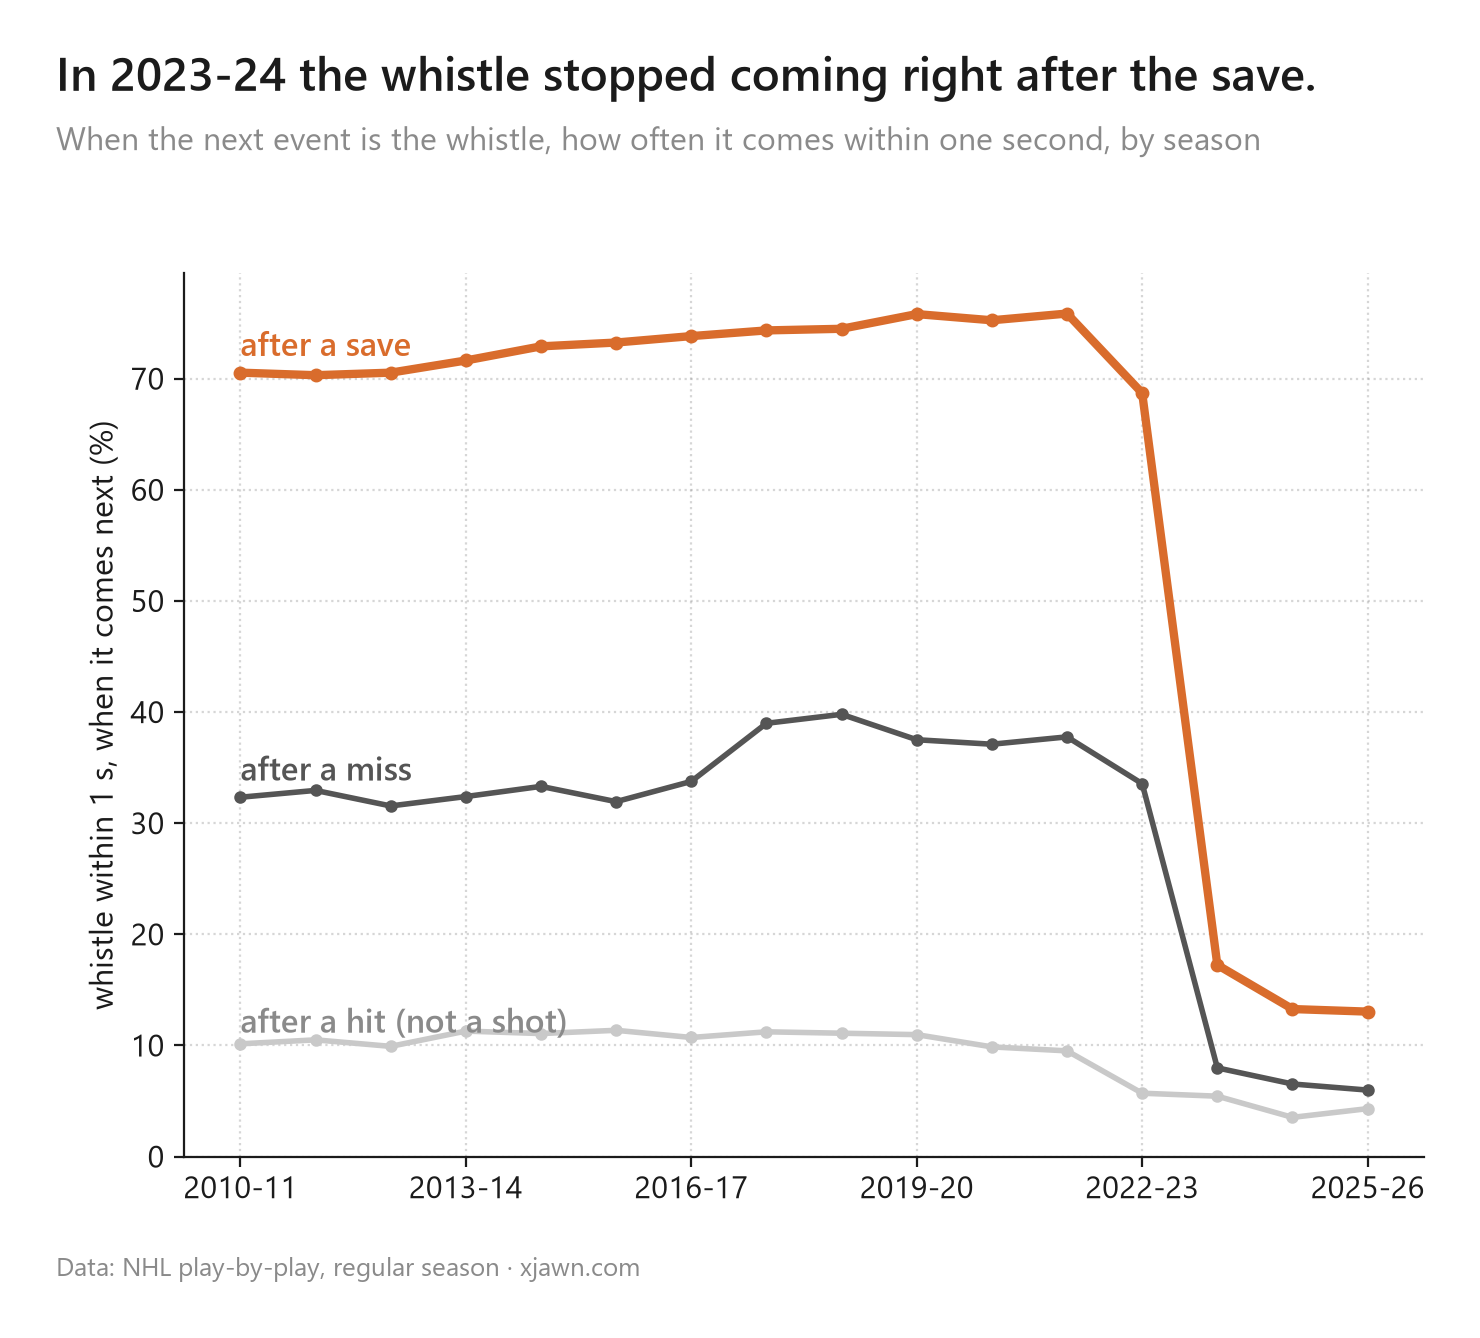
Sure enough. After a covered save, the whistle came within a second 75.9% of the time in 2021-22 and 17.2% in 2023-24, with 2022-23 in between. Misses went from 37.8% to 8.0%. Hits went from 9.5% to 5.4%.
Watching it roll out, rink by rink
The same measure works for one building at a time, and it shows something the season totals hide: the new clock did not arrive everywhere at once. The league switched a few rinks during 2022-23 first.
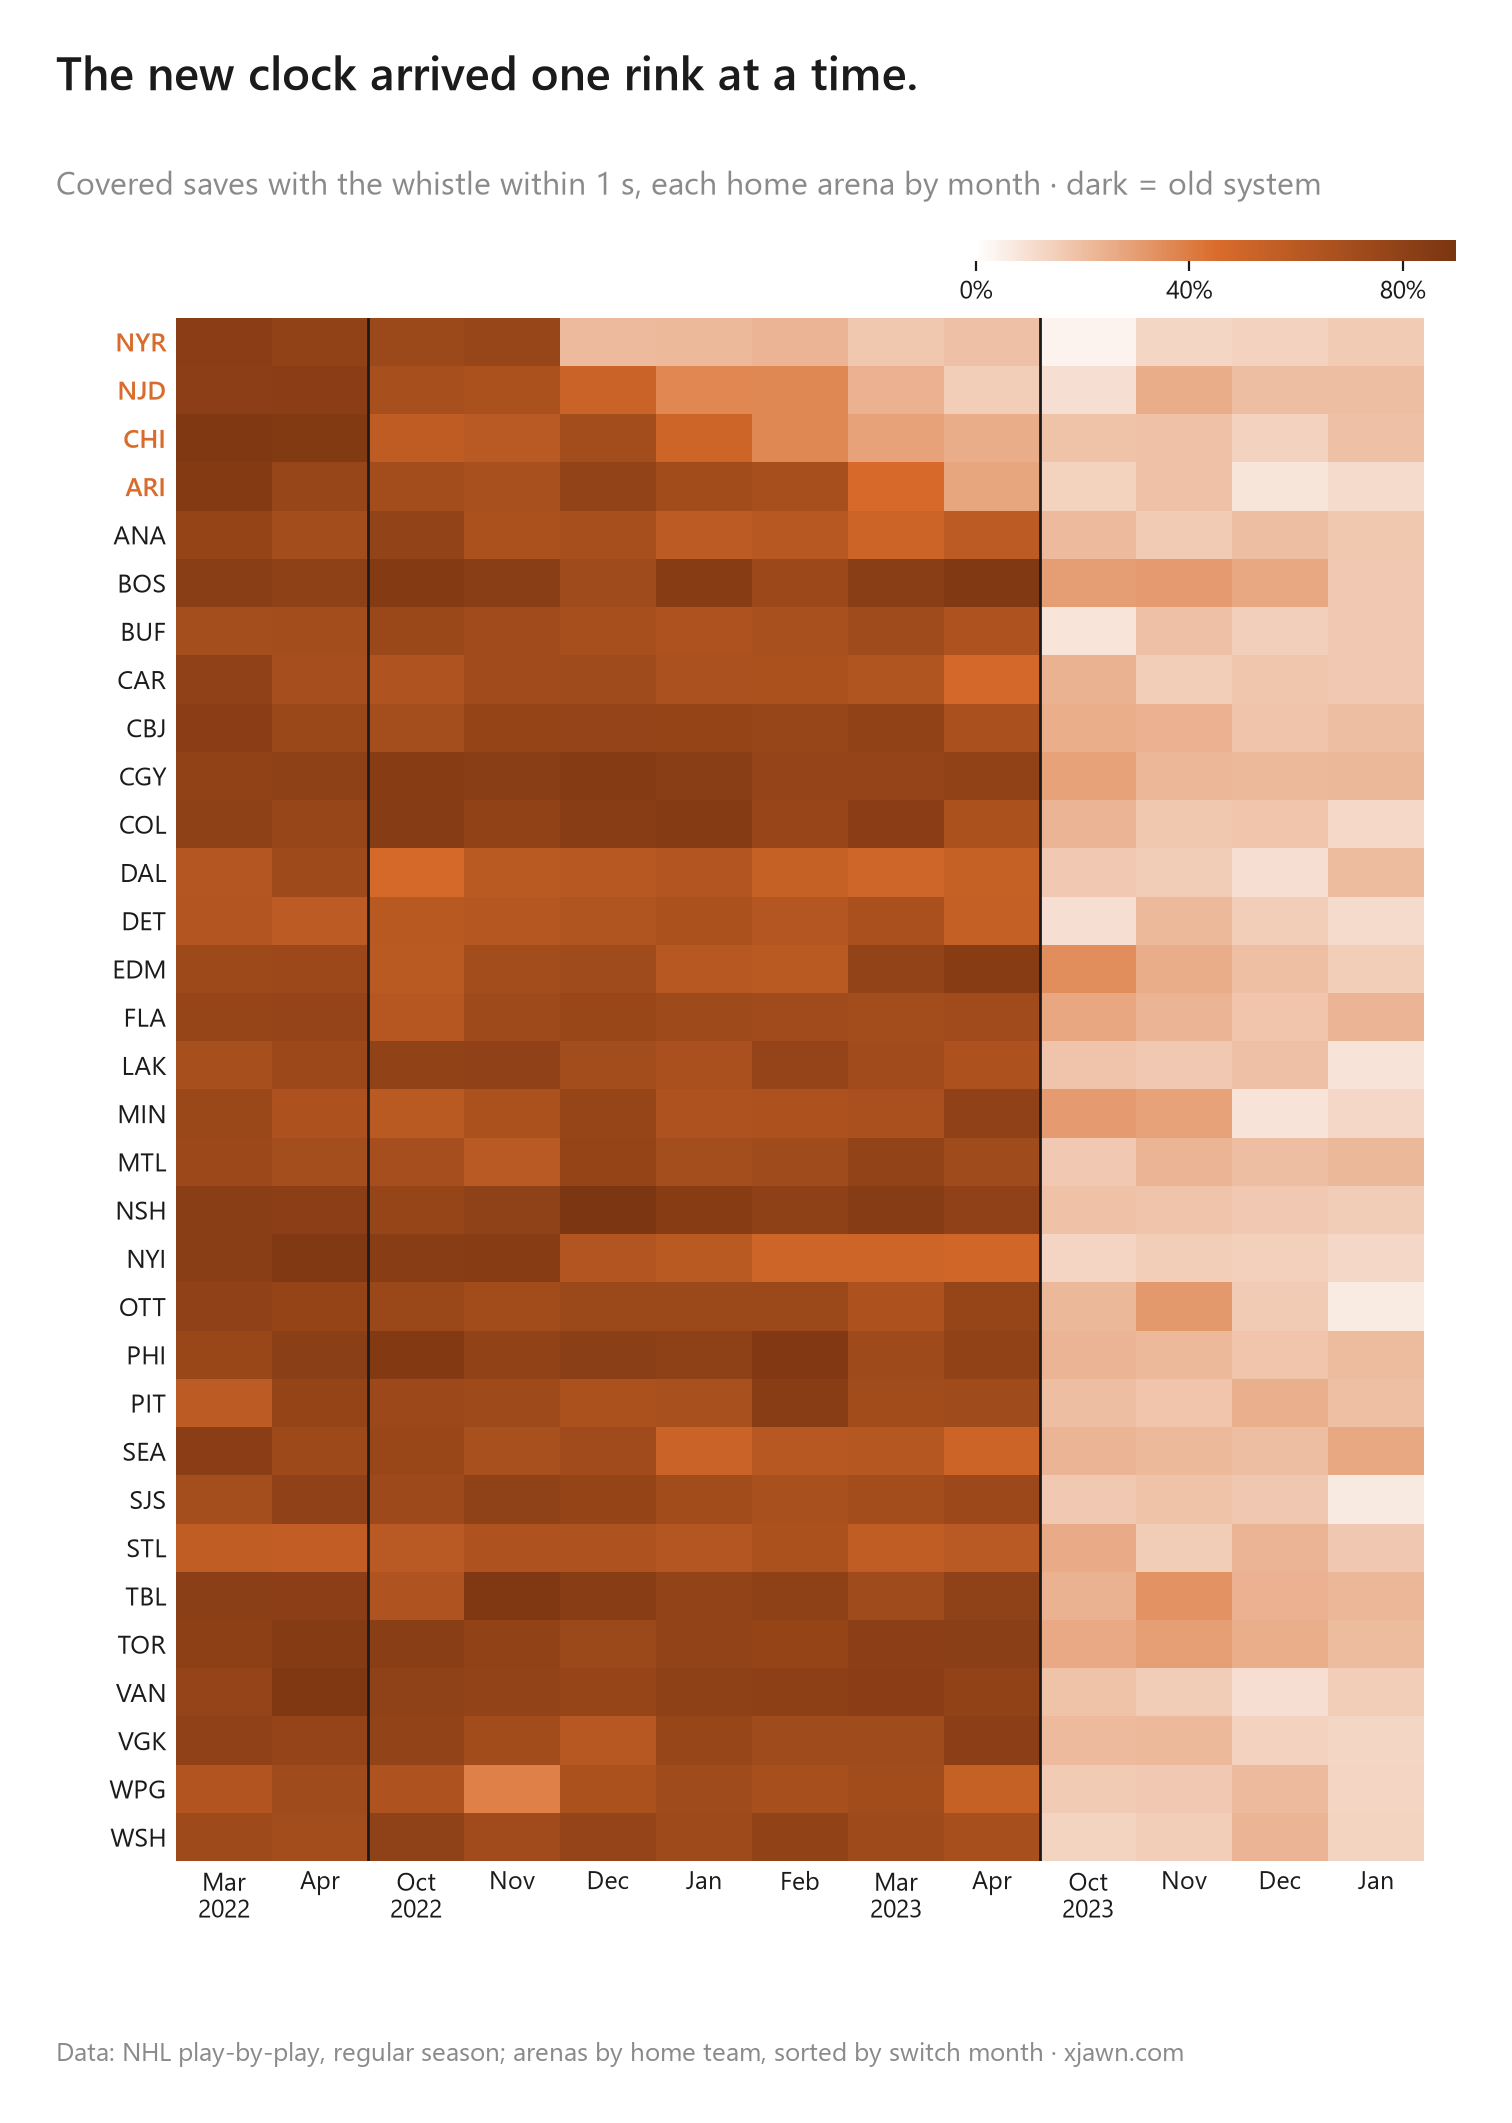
The Rangers' building turned over first, in December 2022. Then New Jersey in January, Chicago in February and Arizona in April, with the Islanders' arena partway there from February. Every other rink switched at the 2023-24 opener. That is also why 2022-23 sits halfway in the attempts chart above.
How late is a goal?
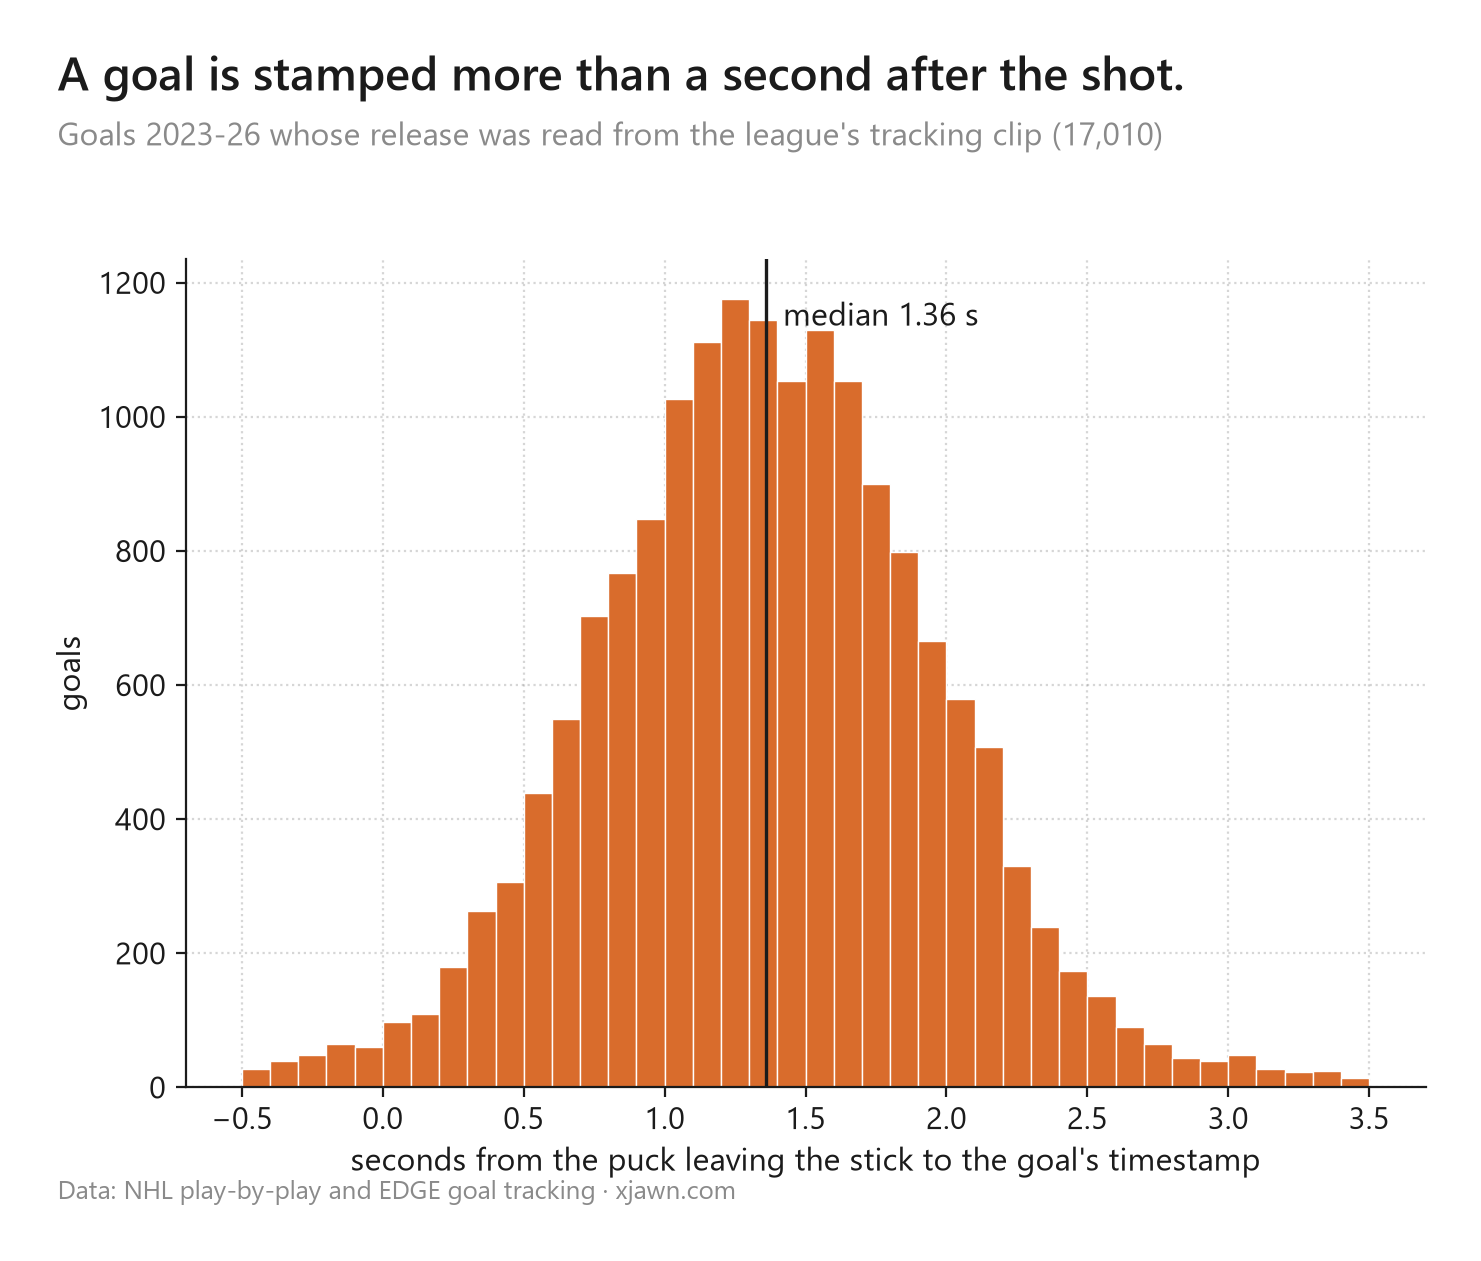
The league publishes a tracking clip of every goal, so we can read the moment the puck left the stick and compare it with the goal's timestamp. A goal is stamped a median of 1.36 seconds after its release, about a second later than a save.
Why that matters: the model learns it
One of the best clues an xG model has is the time since the last event: a shot one second after a pass across the ice is far more dangerous than the same shot from a standstill. But that time now depends on whether the shot went in. Goals sit a second later than they happened, so quick shots stopped scoring in the data.
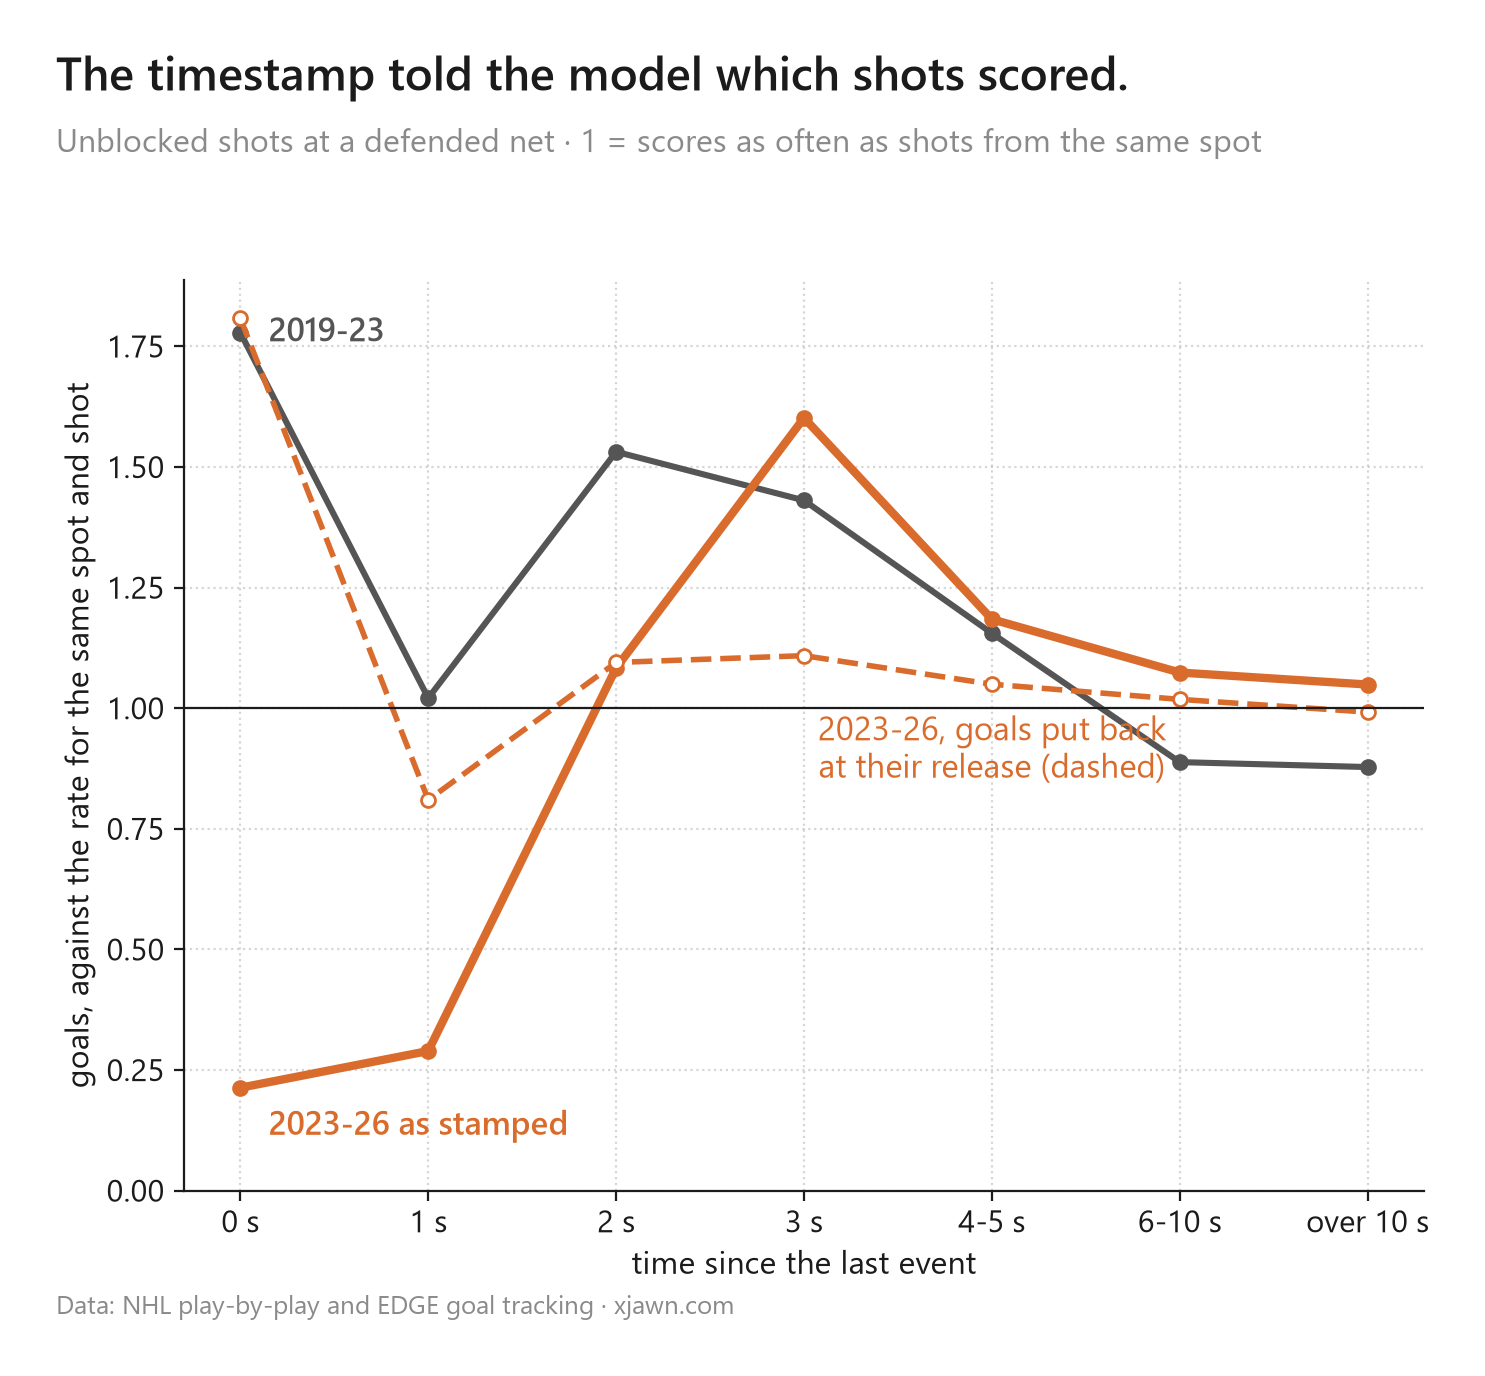
- 2019-23: a shot 0 seconds after the last event scored 1.78× as often as other shots from the same spot. That's the quick shot, and it's real.
- 2023-26 as stamped: 0.21×. The goals had moved a second later, out of the quick bins.
- 2023-26 with each goal put back at its release: 1.81×. The quick shot is back.
A model trained on the stamped data learns the scorekeeper's habit, not the hockey. Ours did. How we fixed it is near the end.
Two more of the same kind
The order of events, 2010-19. Within a second, the old feed's order also depended on the outcome. A shot filed after an event timed later than it was 4.85% of non-goals and 0.07% of goals, about 66 times rarer. Sorting by the clock instead of the file removes it.
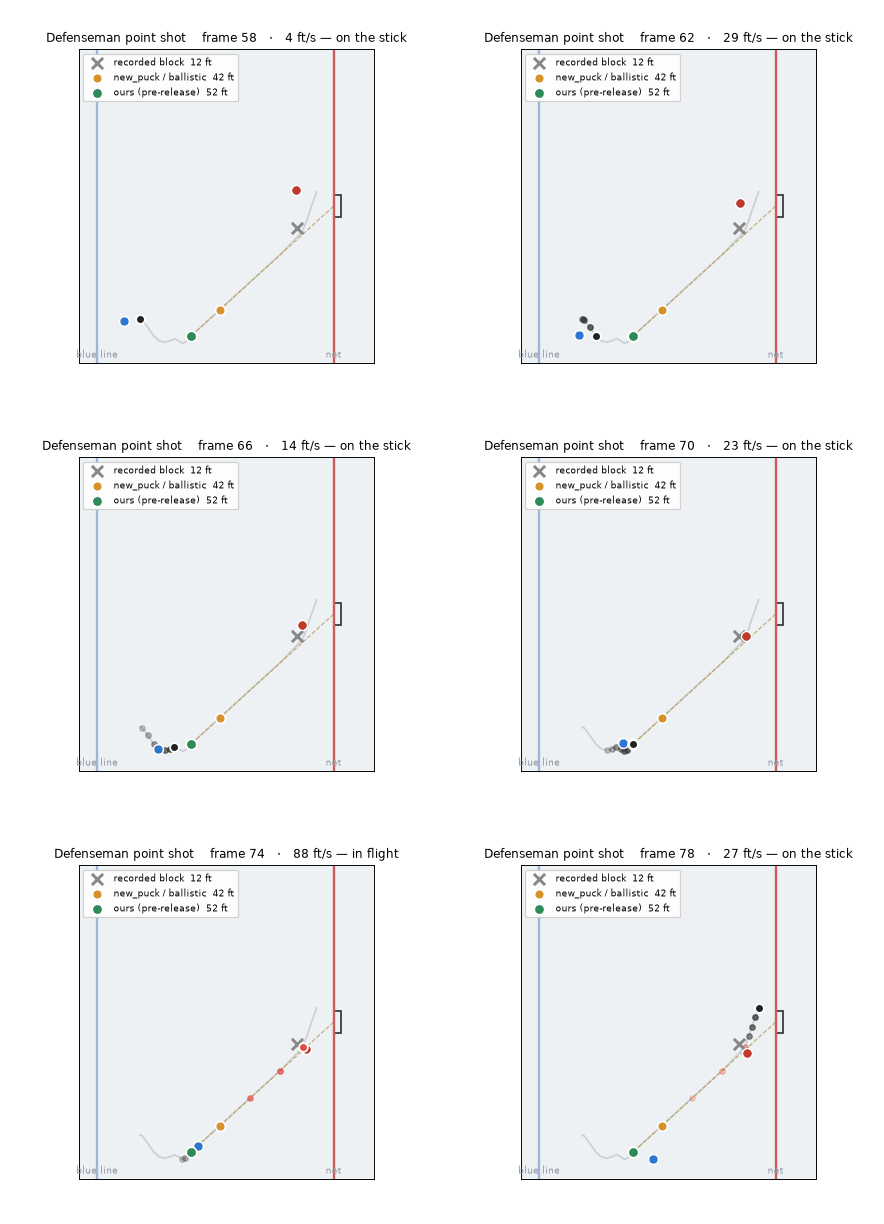
Where a blocked shot is recorded. A blocked shot sits where it was blocked, not where it was taken, which is why most public models leave blocks out. We estimate where each one came from (blocked shots, part 2), but the block point slipped back in: the distance and speed from the previous event were measured to it, so they told the model which shots were blocked.
What it means for every xG number
Season-to-season comparisons of attempts, rebounds or turnovers need a footnote at 2022-24. The bigger question is timing, and it's a question, not a claim: a model trained only on 2023-24 onward sees only stamped goals, so it may have learned the stamping too. In our own model the timing features looked worth +0.017 in AUC on those seasons; with goals put back at release they're worth +0.003. We haven't tested anyone else's model. The fix is cheap for anyone with the tracking clips.
What we changed in our model
We rebuilt our xG model to answer each of these. Here is what the new model does differently from the old one.
- Goal timing. Every goal goes back to the moment it left the stick: read from its own tracking clip for 69% of goals, a typical offset for the rest. The rinks that switched early in 2022-23 are handled the same way. Quick shots score like quick shots again (the chart above).
- The order of events, 2010-19. Events are sorted by the clock, not by the file, so the order no longer gives away the outcome.
- Blocked shots. We already estimated where each block came from (part 2). Now every distance the model uses, including the distance and speed from the previous event, is measured from that origin, never from the block point.
- Turnovers. A giveaway before 2024-25 and a giveaway after it are learned as two different things, the inches and centimeters from above. The model is also told whether the previous event was the shooting team's own.
- The next change. The model knows the season, so a changed definition is learned within its own era. The plan is to refit it every month, so the next change shows up within weeks, not years.
- One we found late. In the final data, an attempt with no shot type is almost always a goal, so both models learned that "no type" means a goal. Live pages now score an attempt whose type hasn't arrived yet as an average over the shot types, and the next refit stops the model reading a missing type as a goal.
How much it matters shows up when you compare each model's predictions with what happened, kind of shot by kind of shot, using predictions made without seeing the game.
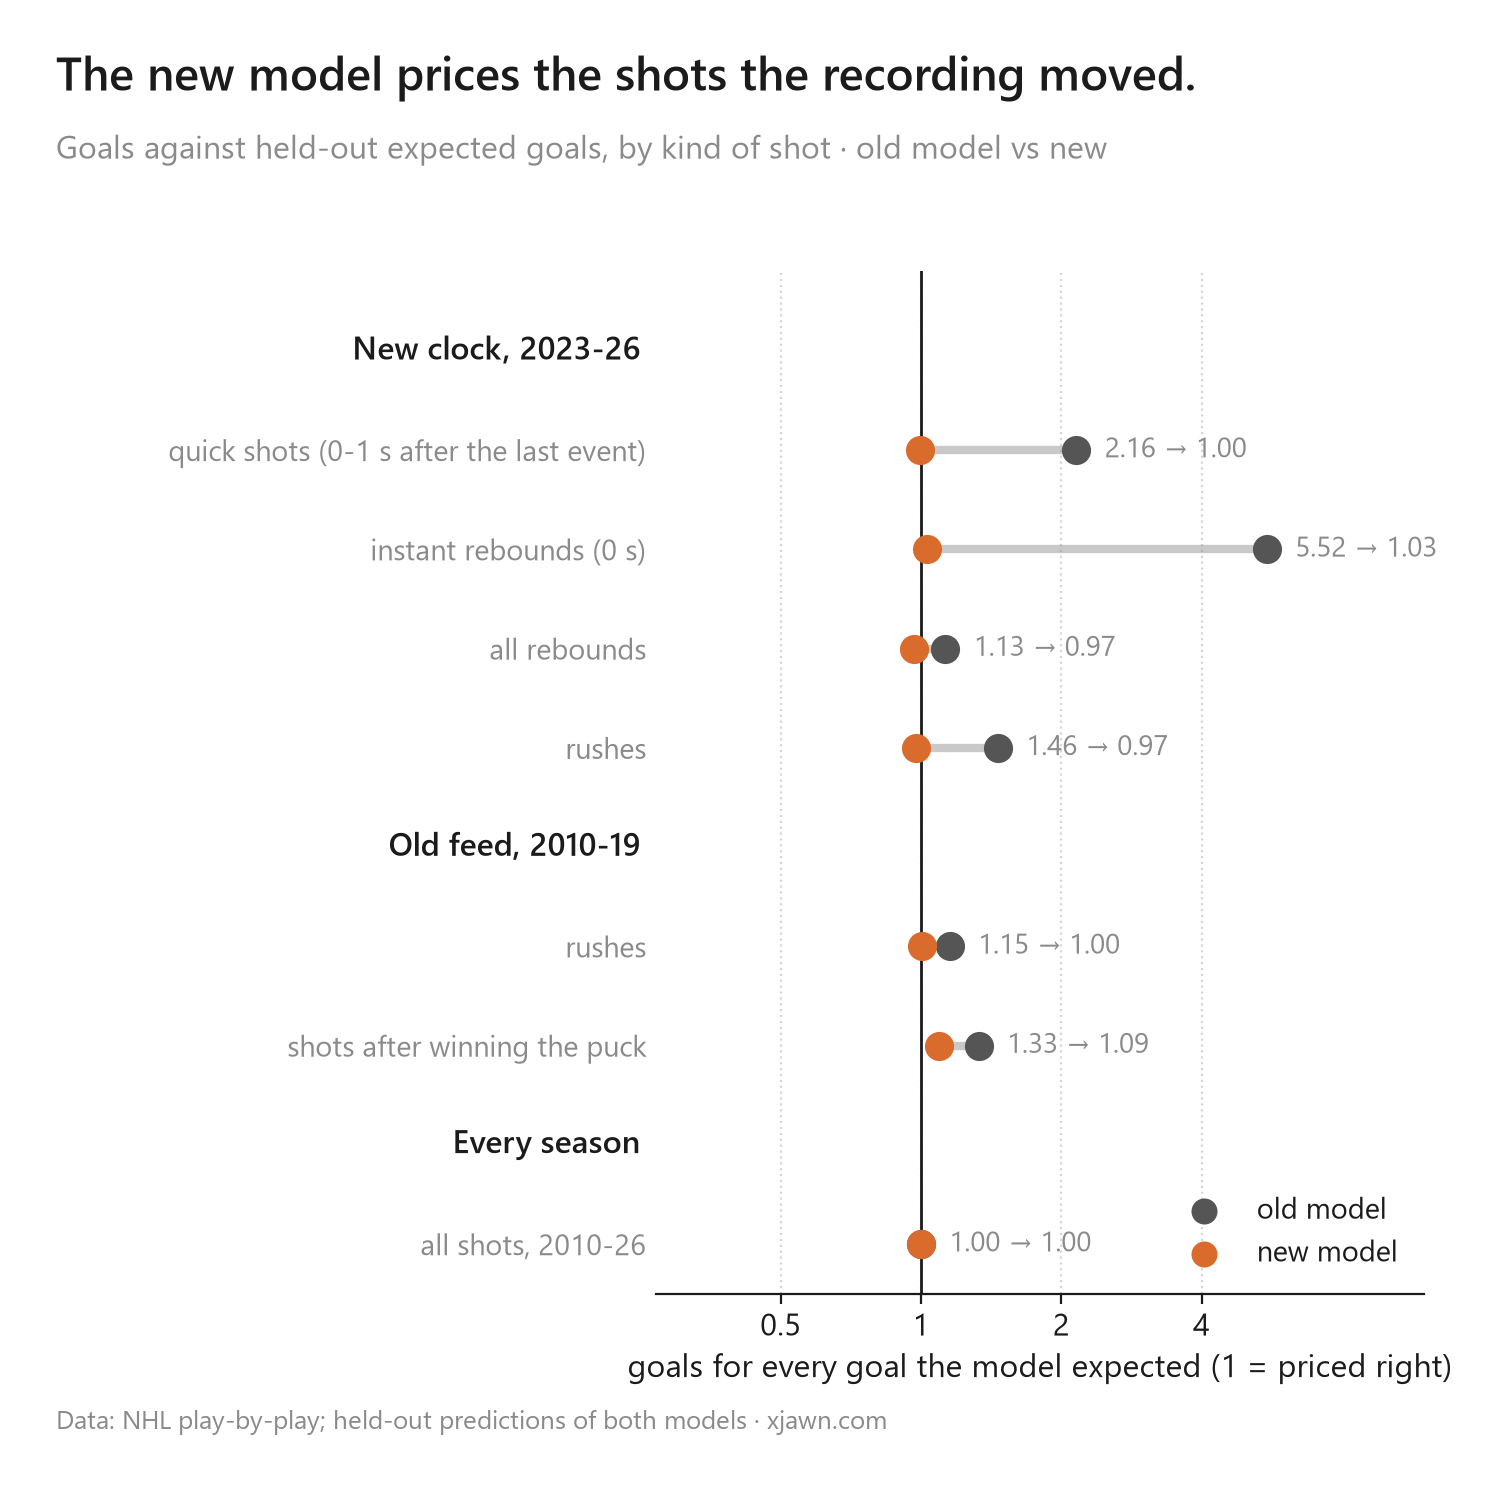
- Quick shots since 2023-24 scored 2.16 times what the old model expected, and 1.00 times the new model's. Instant rebounds were the worst: 5.5 times. Rushes went from 1.46 to 0.97. That is the goal timing.
- In the old feed, rushes went from 1.15 to 1.00, and shots right after winning the puck from 1.33 to 1.09. That is the event order.
- Across all shots both models add up to the goals exactly. The old one was right on average and wrong in exactly the places the recording moved.
On paper the old model even scored as more accurate, most of all in the seasons where it could see the leaks: knowing which shots the scorekeeper treated differently is a shortcut to the answer. The new model gives that up and is right. Teams and players move a little (team margins line up at 0.99, and 28 of the top 30 shooters stay the same), and game forecasts don't move at all: both models pick winners equally well, and they back the same favorite in 223 of this season's first 230 games.
Random thoughts
- The league's own goal clock moved. Its real-time feed placed goals about 0.9 seconds earlier from November 2024 to May 2025, in every rink, then went back at the 2025-26 opener.
- Accuracy moves with the bookkeeping. More logged blocked shots make a season look easier to predict, since a goal is easy to tell from a block. About half of our model's apparent 2023-24 improvement was that.
- 2021-23 is a dip we can't explain yet. Locations ranked shots a little worse in those two seasons, in nearly every arena.
- The NHL has confirmed none of this. The closest it has come is saying shot totals now change after games because of tracking.
Deeper reading
- Alan Ryder, "Product Recall Notice for 'Shot Quality'" (2007)
- Gabriel Desjardins, "Giveaways and Takeaways" (2009)
- Schuckers & Macdonald, "Accounting for Rink Effects in the NHL's Real Time Scoring System" (2014)
- Micah McCurdy, "Scorer Bias Adjustments" (2020)
- Aaron Knodell, "Something Strange Is Going On with the NHL's Play-By-Play" (2024) and "A Brief History of NHL Play-by-Play Data" (2025)
- David Johnson, on tracking and shot data (2025)
- Prashanth Iyer, "It's harder than ever to get a shot on goal" (2024)
- Blocked shots, part 1: why blocked shots belong in xG