What is a 1D? The league's shape says it's a job, not a tier
Everyone sees the steep drop after the top defensemen and calls it a tier. A smooth, tier-free league produces that exact drop for free — and split into creating and suppressing chances, both halves of the job are slopes with no rung on them.
Every hockey argument eventually arrives at the same sentence: "he's not a real 1D." It's the sport's favorite tier dispute, and it hides two different definitions. The popular one: a 1D is a star — a top-10-or-15-in-the-league impact defenseman, a Makar, a Hughes. The precise one is humbler: a 1D is someone who would reasonably hold the 1D job on most of the league's teams. There are 32 of those jobs. The two definitions only agree if defenseman talent falls off a cliff after a small elite — so the argument is secretly a claim about the shape of the league. That shape is measurable. We measured it.
One curve
Give every defenseman one number — our model's stabilized estimate of his 5v5 impact, in goals above league average per 60 minutes (the same projection that powers the Players page). Take the 237 defensemen with a real workload this past season, sort them best to worst, and plot value against rank. Rank 1 is the best defenseman in the league; rank 237 is hanging onto a roster spot. Everything about the tier question lives in this one picture:
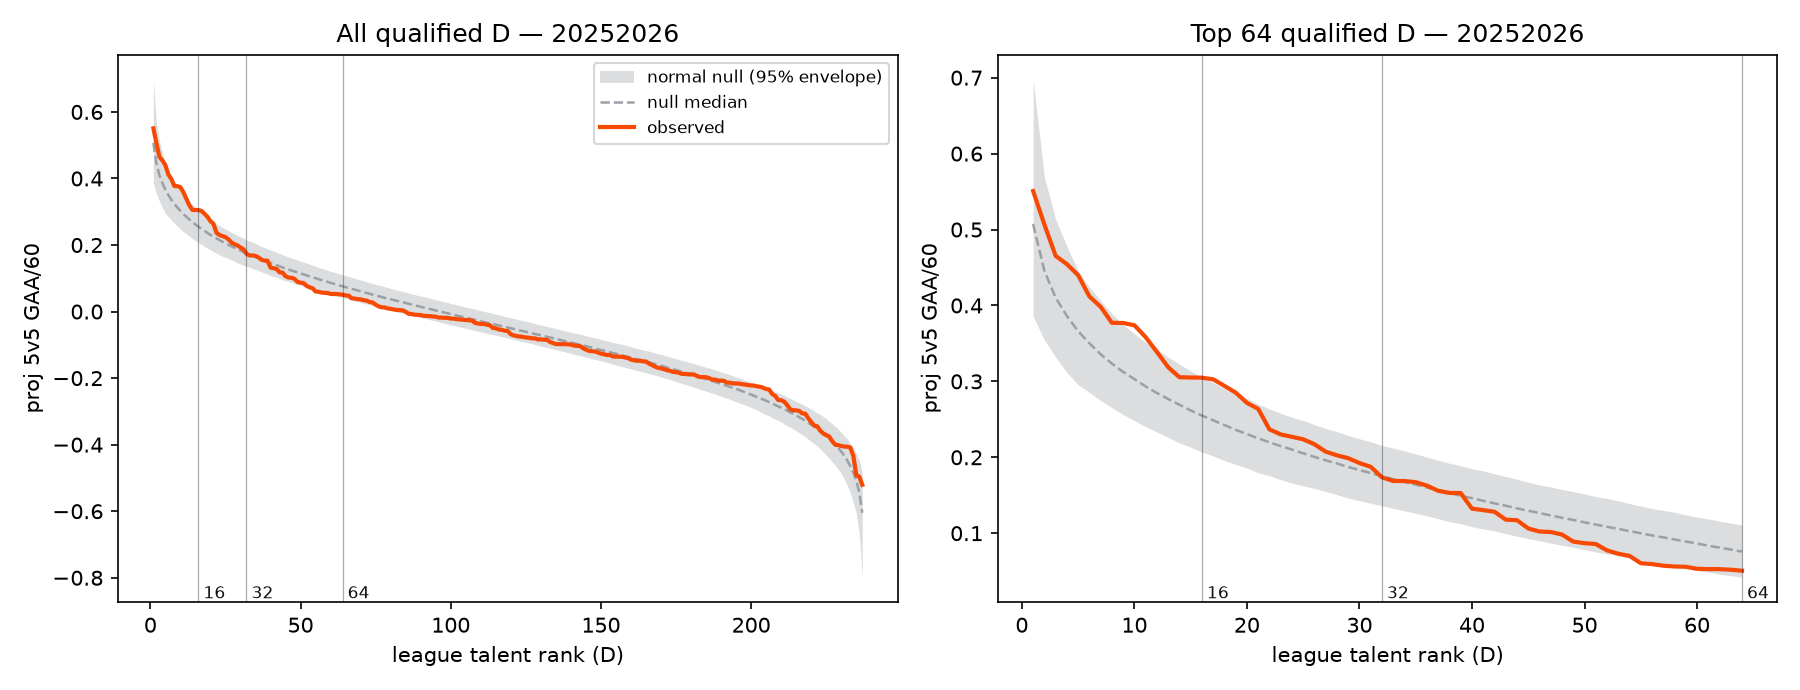
Look at the orange curve and your eye tells the popular story immediately: it plunges through the top 15, then flattens into a long, crowded middle. Steep drop, then everyone else. Case closed for the star tier — right?
The trap
Here's the problem, and it's the whole reason this post exists: that steep drop is free. A league with no tiers at all — talent sprinkled along a perfectly smooth bell curve, no elite club, no gaps — produces exactly that plunge. In the fat middle of a bell curve, players are packed shoulder to shoulder: the 100th-best defenseman and the 101st are basically clones, so the curve runs flat. Out in the tail, players are naturally spread thin, so each step down from rank 1 is a big one. Steepness at the top is what thin air looks like, not what a tier looks like. Your eye will report "stars, then everybody else" on every bell-shaped league ever drawn.
So the question is never "is the drop steep?" It's "is the drop steeper than smooth?" That's what the grey band answers. We fit a bell curve to the real league's talent spread, simulated 4,000 fake leagues of 237 defensemen from it — leagues that are smooth by construction — and marked, at every rank, where those tier-free leagues land 95% of the time. A real tier has a specific signature the band can catch: a plateau at the top (the tier's members are interchangeable) and then a cliff — one gap between neighbors too big for thin air to explain.
One more piece of bookkeeping, because it turns out to decide the whole question. That band is drawn at every one of 237 ranks, so a few of them poke outside it by luck alone — a genuinely smooth, tier-free league escapes at about 3 ranks on average. So "the curve pops out of the band somewhere" is not evidence of anything. The real test is whether it pops out more than luck explains.
What the league actually looks like
Two things, in order of how much they should change your next argument.
First: the famous drop-off is exactly the smooth league's drop-off. From rank 1 to rank 16, the real league falls 0.25 goals per 60. The simulated tier-free leagues fall 0.25 over the same ranks — the same number, within 3%. At a 1D's workload that gap is worth about 6 goals a season, so the star tier is real money — Quinn Hughes over a 16th-ranked guy is a difference you'd pay for. But it is precisely the money a smooth talent curve pays at the top. As evidence of a tier, the steepness is worth nothing.
Second: there is no cliff, and the wobbles are just wobbles. Not one gap between neighbors anywhere in the top 40 is bigger than thin air can explain. The real curve does wander outside the band at 10 ranks — but against the 3 that luck alone delivers, that lands at p = 0.31: about a third of perfectly smooth leagues wobble at least this much. And in the two prior seasons the curve steps outside at exactly one rank each. Three seasons, no tier. If you forced us to draw the boundary the popular definition wants, the data would only shrug.
Break it in half: offense and defense
There's an obvious objection to everything above. A defenseman's job has two halves — create chances at one end, smother them at the other — and a single blended number could easily hide a tier in one half by averaging it against a continuum in the other. Maybe there's a real tier of offensive drivers, or a real tier of shutdown types, and mashing them together is what makes the league look smooth.
So we split the number in two and ran the identical test on each half. Same simulated leagues, same band, same question. Here's offense — chances created with him on the ice:
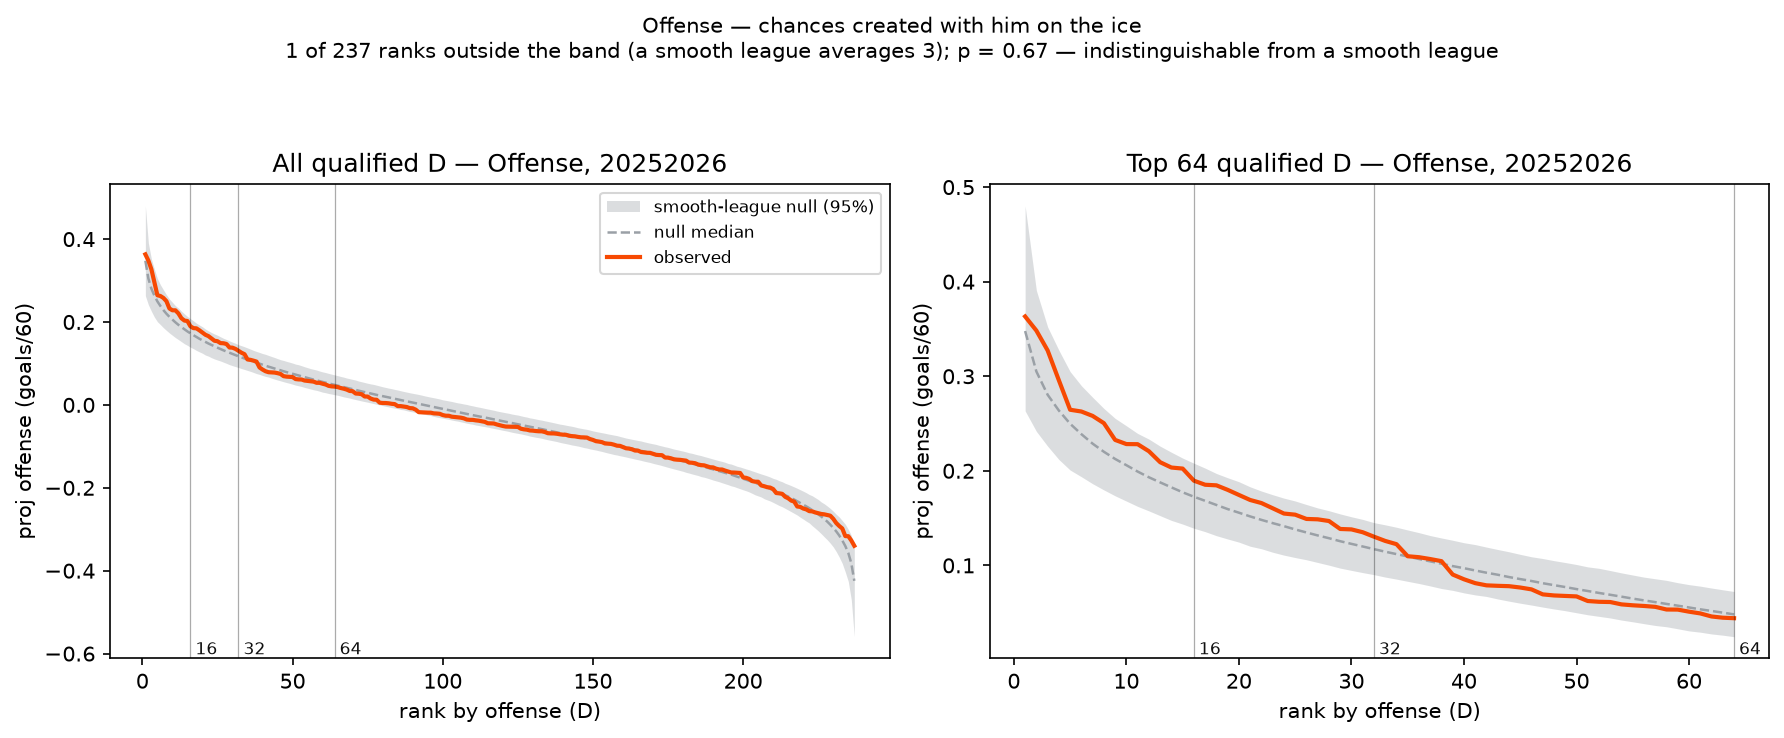
The drop from rank 1 to 16 is 0.174 goals per 60; the smooth tier-free league's drop is 0.175. That's a ratio of 0.99 — the real league and the fake one are the same curve. Exactly 1 of 237 ranks steps outside the band, against the 3 luck hands out for free. Now defense — chances suppressed:
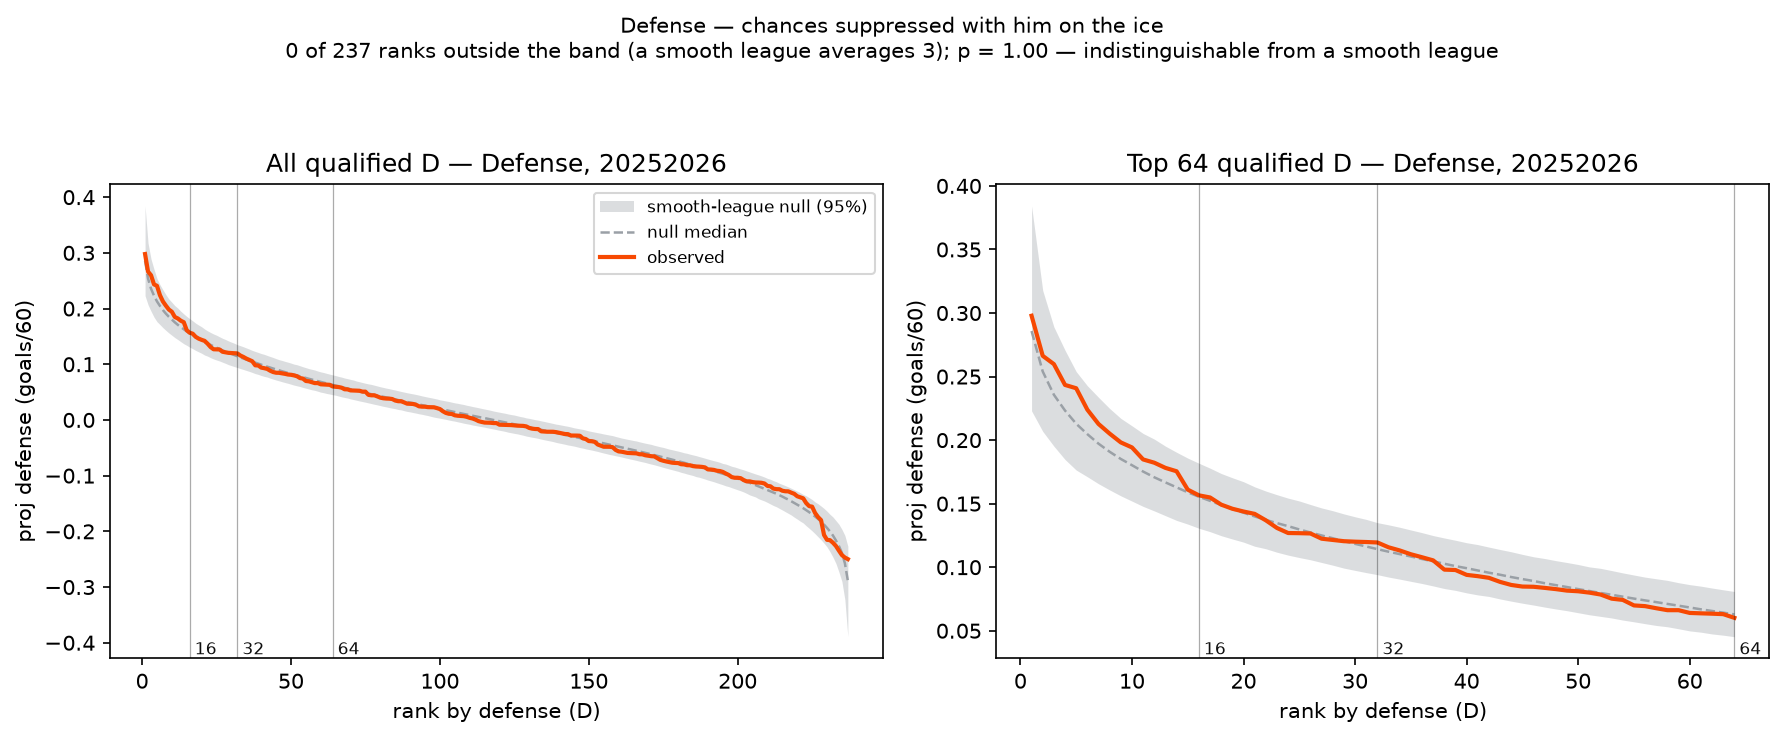
This one is almost comically clean: zero of the 237 defensemen fall outside the band. Not one. A genuinely smooth league usually produces about 3 stragglers by chance; the real NHL produced fewer. There is no tier of shutdown defensemen. Chance suppression is a perfectly graded slope from Seider and Slavin down to the third pair, with no rung anywhere on it. And putting the halves back together:
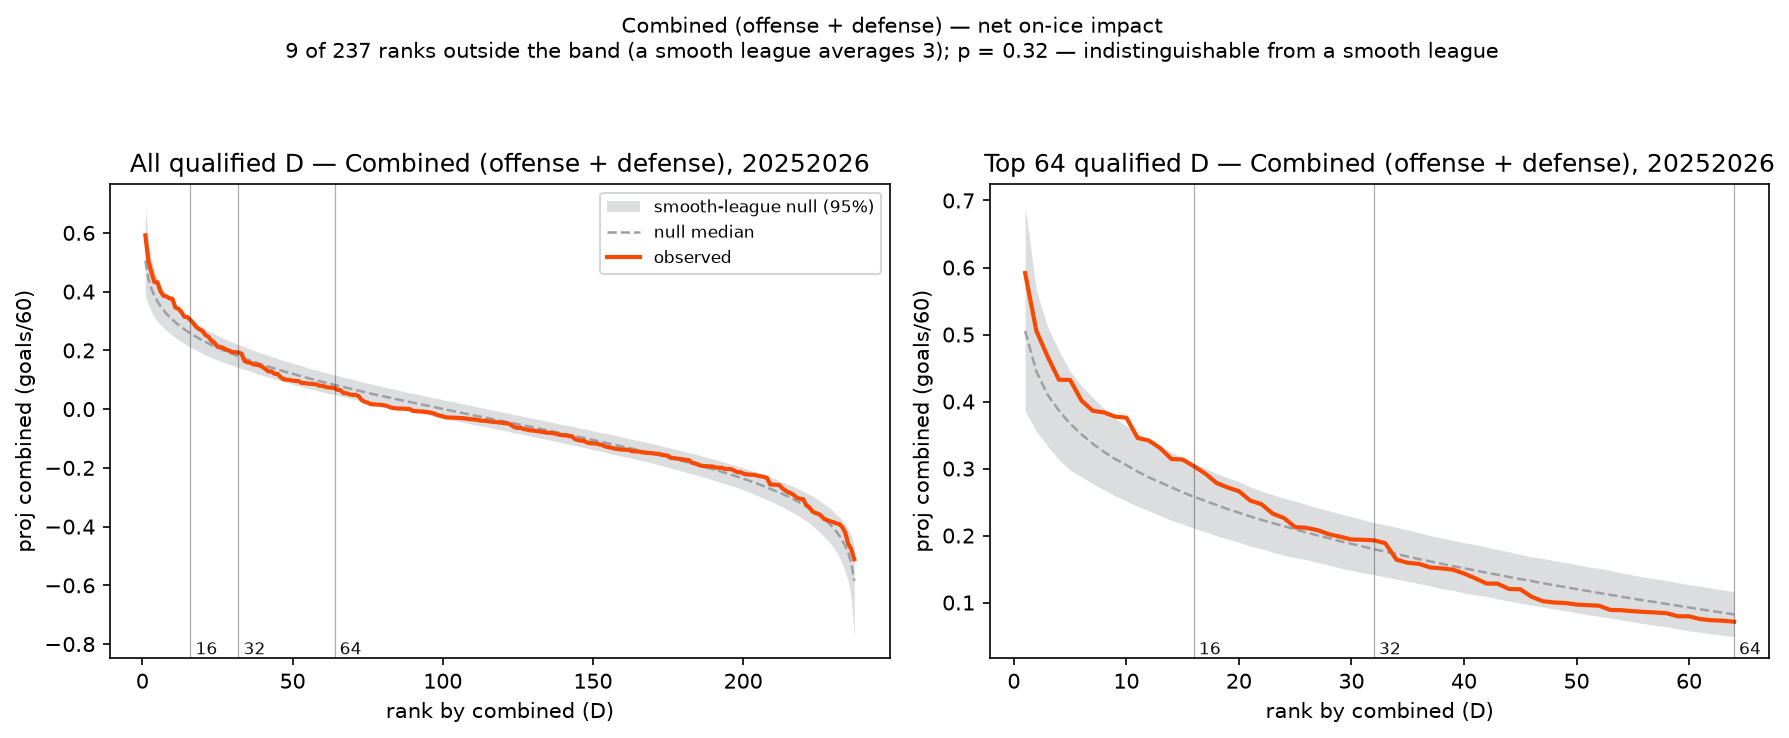
The combined view is where the tier story comes closest to breathing: its slide from 16th to 32nd runs 1.4× the smooth league's. But 9 escaping ranks against a typical 3 is p = 0.32 — a wobble, not a wall. Three different ways of asking, three continuums.
Two things the split did turn up
The tier hunt came back empty, but the decomposition found two facts worth more than the thing we were looking for.
Defensemen separate themselves by offense, not defense. The spread in offensive value is 1.34× the spread in defensive value (0.140 vs 0.104 goals per 60). The gap between the league's best and worst puck-movers is simply bigger than the gap between its best and worst defenders. That also squares with something we found in an earlier post: offense repeats year to year far more reliably than defense does. The half of the game that separates players most is also the half you can trust.
And the two halves are mostly different people. Take the 16 best offensive defensemen and the 16 best defensive ones — only 4 names appear on both lists (Adam Fox, Damon Severson, Jordan Spence, Shea Theodore). The rank correlation between the halves is just +0.25. So "who's the best defenseman" isn't one question with one answer; it's two questions with largely different answers, and which one a team is asking depends on what its roster is missing. That, far more than any tier, is why the 1D argument never resolves.
So who actually holds the job?
The precise definition — would he be the 1D on most teams? — we can test directly, because every team already answered it. Take each team's actual 1D: the defenseman its coaches gave the most ice time. Those 32 incumbents are the league's revealed answer, and laying them over the talent curve produces the punchline of the whole analysis:
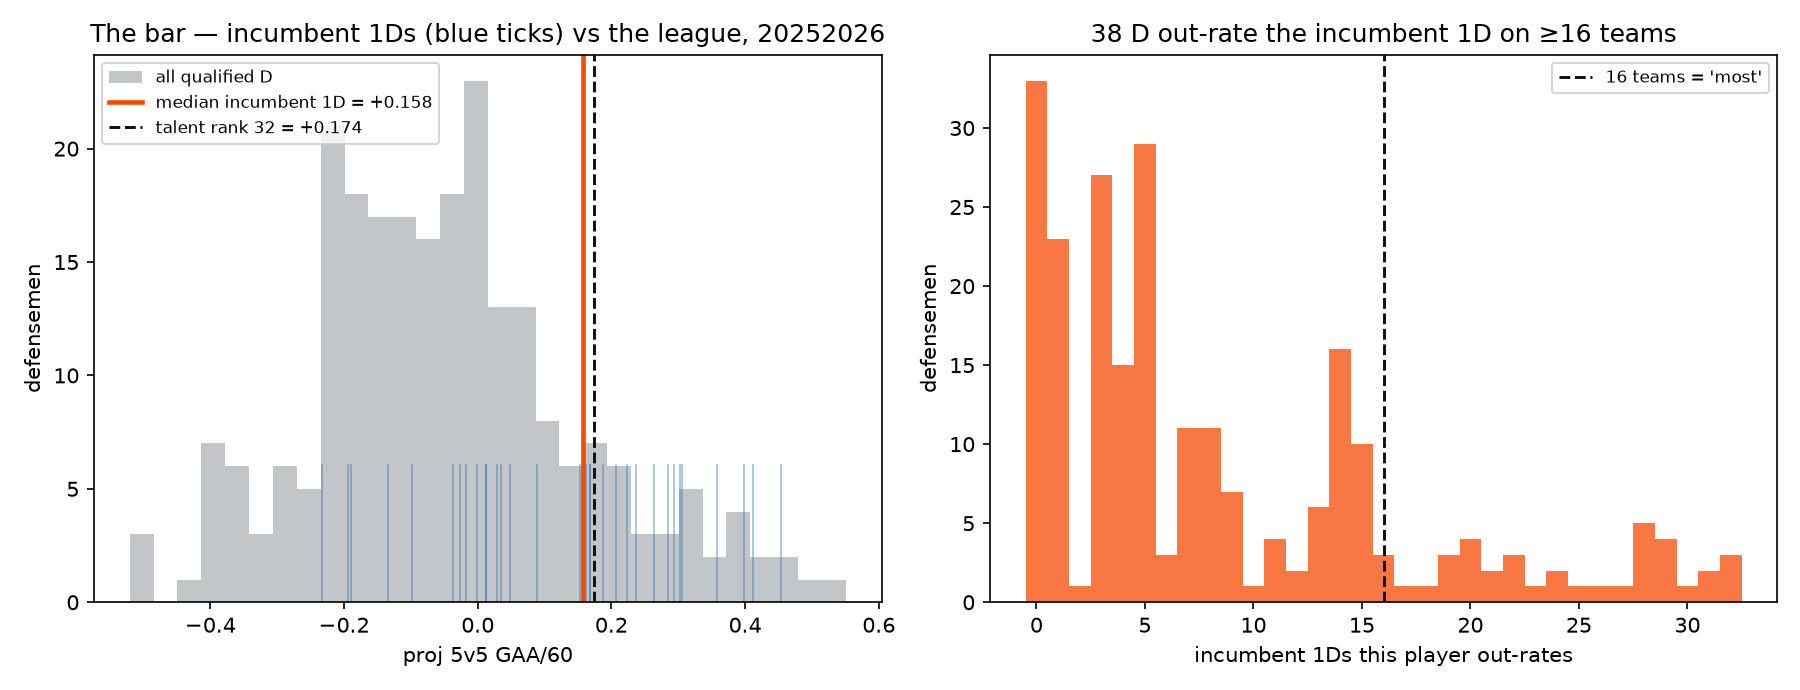
The median incumbent's talent sits at +0.16 per 60 — almost exactly the league's 32nd-ranked defenseman (+0.17). Collectively, the league's 32 jobs really are calibrated to the top-32 mark. Individually, it's chaos: only 13 of the 32 job-holders are actually top-32 by talent — the blue ticks scatter across most of the distribution — and 38 defensemen out-rate the incumbent 1D on at least 16 teams (49 on an alternate measure that includes special teams and finishing). By the precise definition, the NHL has roughly a team and a half more 1Ds than it has 1D jobs.
The honest caveats
Two, and they matter. Our talent number here is 5v5 only — and the popular 1D archetype is substantially a power-play creature. Cale Makar ranks 110th on this axis in 2025-26, which is not a hot take about Makar; it's the axis telling you what it doesn't measure. (The all-situations alternate measure above reaches the same counts, but it's noisier.)
And a null result is not proof of absence. "We can't tell this league apart from a smooth one" rules out a big tier; it can't rule out a subtle one. Our talent estimates are also deliberately conservative — they pull extreme seasons toward the middle to avoid being fooled by small samples, which means that if a true elite tier existed, this method would blur its edges rather than sharpen them. That cuts one way only, and it's the honest place to point a skeptic.
In that spirit, one correction. The first version of this post claimed a shelf — a surplus of quality around ranks 9 through 19, based on the curve poking above the band there. Then we ran the arithmetic in the box above: the band gets checked at all 237 ranks, luck alone pushes about 3 of them outside, and the excursion we'd gotten excited about lands at p = 0.31. It was noise, and we've retracted it. The finding it replaced is simpler and stands on firmer ground: smooth, all the way down, on every axis we can measure.
The answer
"1D" is a job, not a tier. The steep drop everyone points at is a property of bell curves, not of hockey; split the game into creating and suppressing and both halves are smooth slopes with no rung on them; and the bar for holding the job — set by the players who actually hold it — sits near rank 32, with some 40-to-50 defensemen good enough to clear it. The closest thing to a real division isn't vertical at all: it's that the best creators and the best suppressors are mostly different people.
So the next time the argument starts, both sides can be right: he's not a top-ten defenseman, and he'd be the 1D on most teams. The league is built that way on purpose — it just never wrote it down.