Model v2: putting the players back in
v1 was deliberately talent-blind. v2 gives the model shooters, goalies, and teammates — measures what that buys, and ends up scoring the site.
Model v1 is deliberately blind to who is shooting. That is not an oversight — it is the only way finishing stays measurable. If the model already knows Auston Matthews is shooting, his talent gets baked into the prediction and vanishes from the residual, and goals-minus-xG stops meaning anything.
Updated 20 July 2026 — v2 now scores the site. When this was written, everything below sat beside the scoreboard: v1 scored the tables and v2 produced ratings surfaces. That changed. The third attempt described here — the joint fit — has an identity-blind half, and that half became the canonical model behind every xG number on this site. The yardstick is still talent-blind, so nothing about why v1 was built that way has been abandoned. The promotion section below has the reads, including the pre-registered bar it failed.
Updated 25 July 2026 — the structural half went nested. The
canonical model is now nested_structure__nested_structure_xg__d2ec2662 — no longer the flat structural half
above, but the nested export of the same joint fit. One shot becomes the three chained
questions that actually decide it — does the attempt get through? →
is it on net? → does it go in? — with each stage's structure re-estimated net
of that stage's own people terms (shooters, goalies, and the blockers in front of them), then
composed with every player term left out. The talent-blind contract is unchanged; only the
chassis under it is. The fitted artifact was rebuilt once since (August 2026) on corrected
blocked-shot origin imputation — a data fix, not a design change. The
promotion section below stays the record of the flat half's
adoption and the bar it failed; Model v3 is what
came after it, and the
nested design doc is the
contract underneath it.
But blindness has a cost, and v2 is about measuring it. Two costs, actually:
- The people axis goes unmeasured. Whether a chance converts is shaped by everyone on the ice — the shooter, the teammates who created the look, the defenders closing the lane, the goalie. v1 prices the location and calls it a day.
- Blindness is not neutrality. A model fit without identity quietly absorbs whatever talent correlates with its features. Skilled shooters take a disproportionate share of their attempts from good spots, so the location terms get inflated by talent — and then under-credit exactly those shooters. A talent-blind baseline can never hand that credit back.
v2 attacks both, three different ways, and the honest headline is that two of the three failed. Everything below was pre-registered on 2026-07-14 — the bars, the gates, the comparators — before any v2 model was trained. That matters more than usual here, because this corpus is a plateau where reasonable variants tie to the third decimal, and without a bar fixed in advance you can always find a story.
Attempt 1: just put the names in the model
The obvious thing first. Hand the booster primary_player_id and
goalie_id as ordinary categorical features and let it learn what it wants. The bar:
beat the v1 baseline's held-out log-loss by at least 5×10⁻⁴, and improve in a
majority of seasons.
It never came close. Fifteen identity models across the shooter and goalie axes, 240 season-level comparisons, zero wins. The best arm lost by 2.0×10⁻³ — four times the adoption bar, in the wrong direction. Log-loss and danger AUC agreed in every single row, so this is not one metric being difficult.
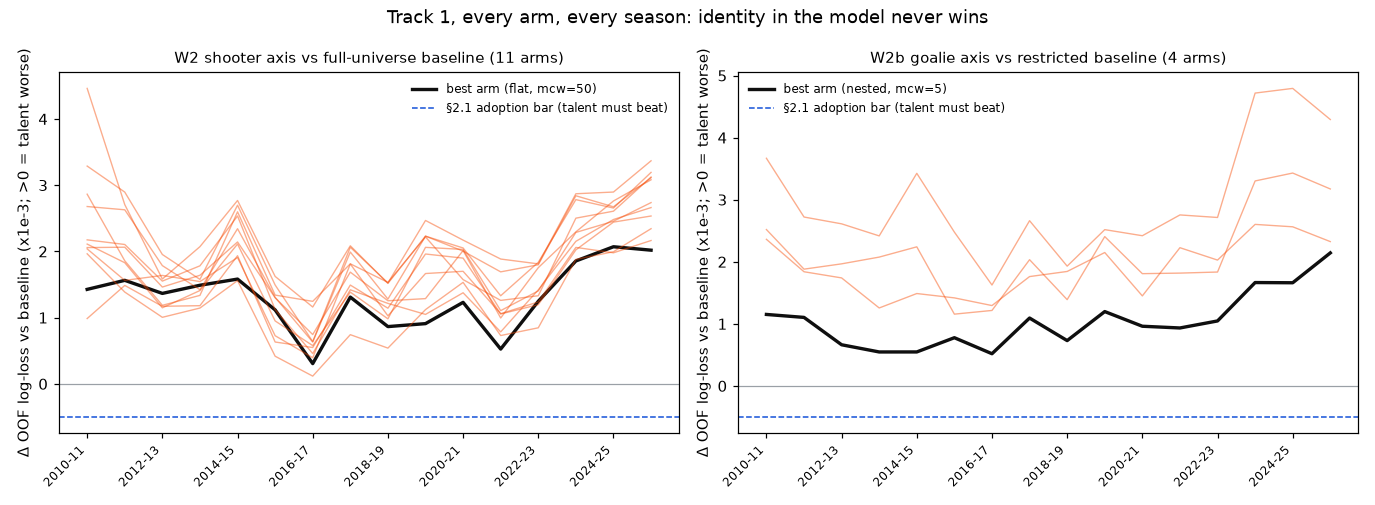
The tempting explanation is overfitting — thousands of shooters, many with a handful of shots. But the goalie axis kills that: roughly 103 goalies a season, each facing thousands of shots, the lowest-cardinality and highest-volume identity feature available. It lost by the same margin (−2.1×10⁻³). And the damage is additive — stacking shooter and goalie hurts about as much as the sum of hurting separately.
Raw identity, dropped in as a feature, does not help this model at any cardinality. That track is closed.
Attempt 2: a shrunk skill layer on top
Different shape. Leave the baseline alone, and fit a thin penalized layer on top of its predictions — a per-player offset in log-odds, with an explicit prior shrinking every player toward league average:
logit P(goal) = logit(baseline xg) + δshooter + Σ θoff − Σ θdef − ωgoalie
Four components: finishing (your own shots), supporting (your teammates' shots while you're on the ice), defending (shots against you), and saving (goalie, on-net shots faced). Signs are arranged so positive always means good. Finishing and supporting are fit on disjoint sets of shots, so "elite finisher" and "elite playmaker" are separate, non-competing measurements rather than one number fighting itself.
Two gates had to be cleared to ship a component: it has to be persistent (a player's rating in one random half of the shots predicts the other half), and it has to predict (add held-out lift). Here is where each landed:
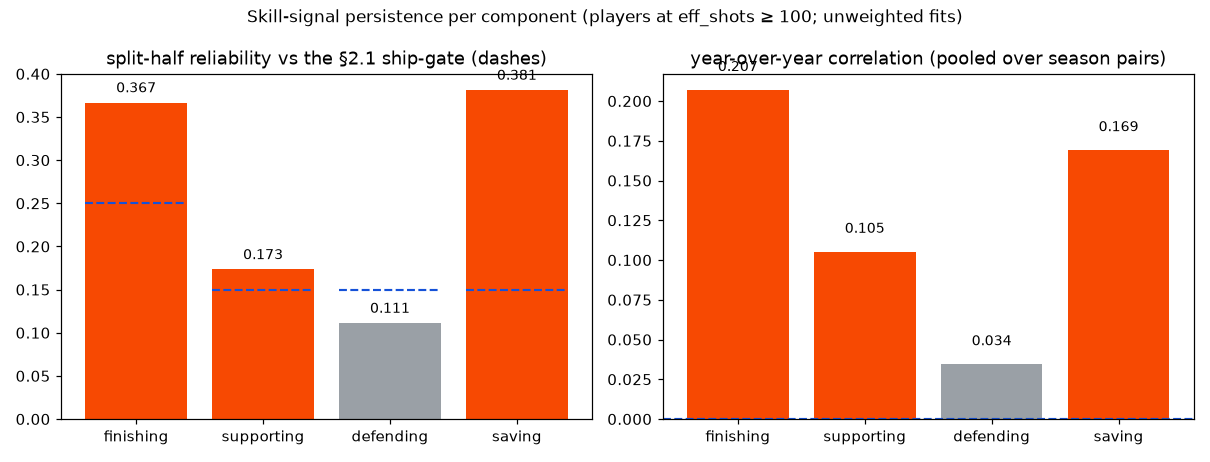
So the shipped layer is a reduction — finishing and saving only. Adding the on-ice components does not merely fail to help, it actively dilutes: held-out lift goes from +2.90×10⁻⁴ (reduction) to +2.88×10⁻⁴ (full design), and falls off a cliff if you loosen the on-ice prior at all.
The plain finding, stated as unhappily as it deserves: a skater's influence on whether a teammate's shot goes in is not detectable as held-out signal in 2.34 million public-data shots. That may be because the effect is genuinely tiny, or because what persistence does see in "supporting" is shared line and team context rather than the individual. Distinguishing those two is not another per-shot model's job.
Attempt 3: fit the structure and the people together
This one worked. If the problem with v1 is that its location terms silently absorbed talent, then don't fit them separately — alternate. Fit the booster with the current player offsets handed to it as a fixed head start, re-fit the player layer against the new booster, and repeat. This is a backfit toward a partially linear model, and it is cross-fitted at the game level throughout: no quantity a shot is scored with may derive from that shot's own game.
The absorption was real and it is now measured. As the loop converges, the amount of signal the player layer can find grows by 11.5–16% — that is credit the talent-blind structure had been holding onto, being handed back.
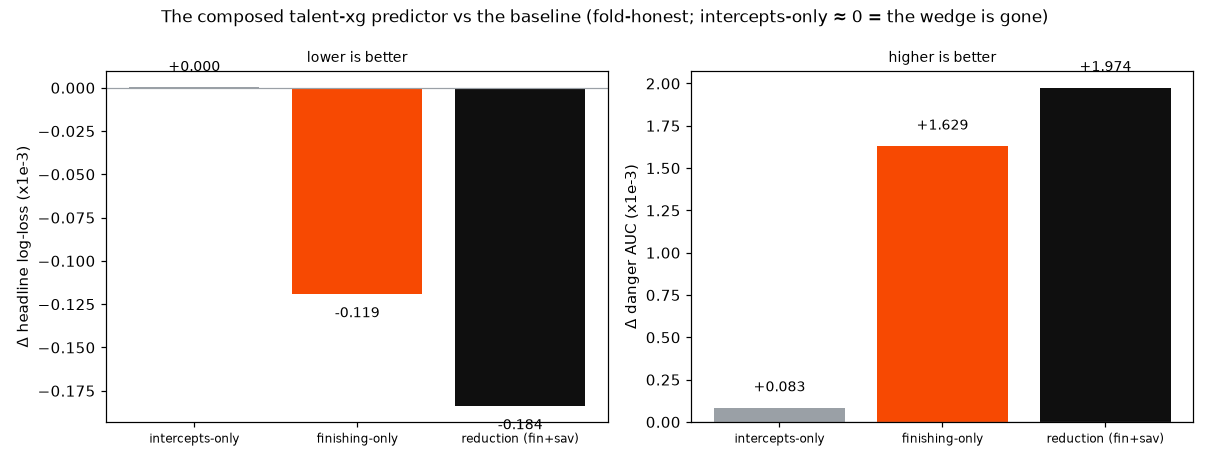
Small, real, and it survives contact with the danger AUC — the metric computed only on shots that reached the net, where the measurement artifacts below cannot reach.
The part where we were nearly fooled
Twice, the layer looked far better than it was, and both times the gain had nothing to do with players.
The wedge. The goalie block was keyed to the event's goalie id — which is null exactly when a shot is blocked. Blocked shots almost never go in, so a column that is "present iff unblocked" hands the model a free look at the outcome. It was worth +3.85×10⁻³, thirteen times the adoption bar, and none of it was skill. Fixing it meant re-keying saving to the pre-shot goalie — who was in net when the puck left the stick, whether or not the shot got there.
The clip. Nearly 10% of shots (224,592 deep-blocked attempts) are predicted below one-hundredth of a percent. Merely capping those predictions is worth −6.5×10⁻⁴ on its own, again for no reason involving a player. So every comparison in this post is against a baseline put through the same clip.
The grey zero-information bar in the figure above is the standing check that both are gone. Before the fix, that same bar was worth +3.85×10⁻³ of pure structure. This failure mode — a column whose presence encodes the outcome even when every value in it is innocent — showed up five separate times in v2, which is why the project now has a leak gate that refuses to fit rather than a diagnostic that prints a warning.
The other margin: RAPM
Everything above is about quality per attempt — the probability a given shot goes in. For most skaters that is not the main lever. The bigger one is volume: generating more attempts and conceding fewer. No per-shot model can see that, because it only ever looks at shots that happened.
So there is a second, structurally separate estimator. RAPM — regularized adjusted plus-minus — regresses on-ice expected-goal rates per 60 against who was on the ice, controlling for score state, zone starts, home/period, and penalty shadows. The unit is the stint: a maximal interval over which nobody changes and the strength state holds constant. There are 6.40 million of them, across 20,583 games and 20,908 hours of hockey.
Two design choices are load-bearing:
- It regresses on expected goals, never actual goals. That structurally excludes finishing, shooting luck and goaltending from the rate coefficients — which is exactly what makes it addable to the finishing rating above instead of double-counting it. RAPM measures everything except conversion; the ratings layer measures only conversion.
- Sum-to-zero group penalties mean every coefficient reads relative to league average by construction — there is no reference player.
And then the pre-registered reliability gate failed, in all 31 tests, and the verdict stands unedited:
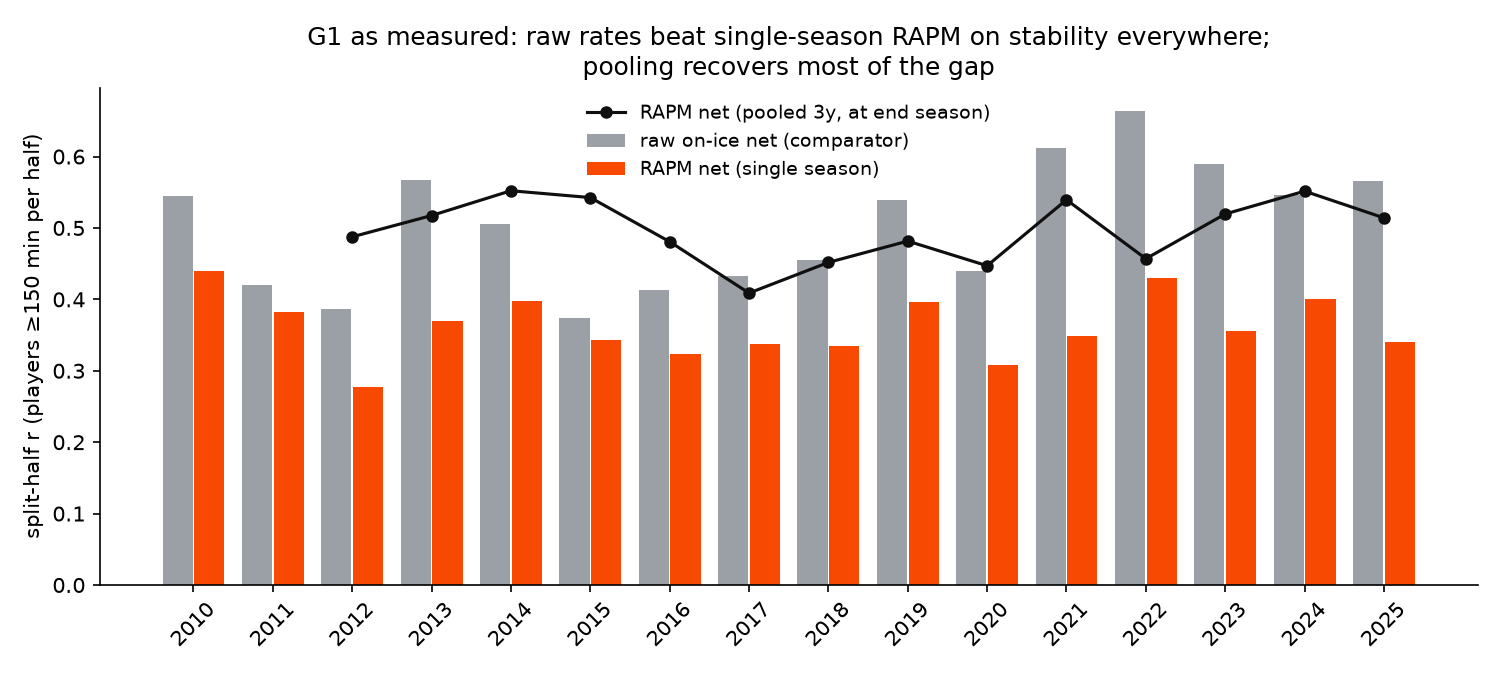
Which raises the obvious question: if raw on-ice rates are more stable, why adjust anything? Because stability is not the same as being right. Raw rates are stable partly because they carry the stable context — deployment, linemates, team system — that RAPM is deliberately removing. A player's team name alone would be perfectly "stable" and tell you nothing about the player.
So the failed gate was replaced by a harder one, registered before it was computed: forget split-halves, just predict next season's results, and check separately what happens to players who change teams. If an isolate is doing its job, that is precisely where it should pay.
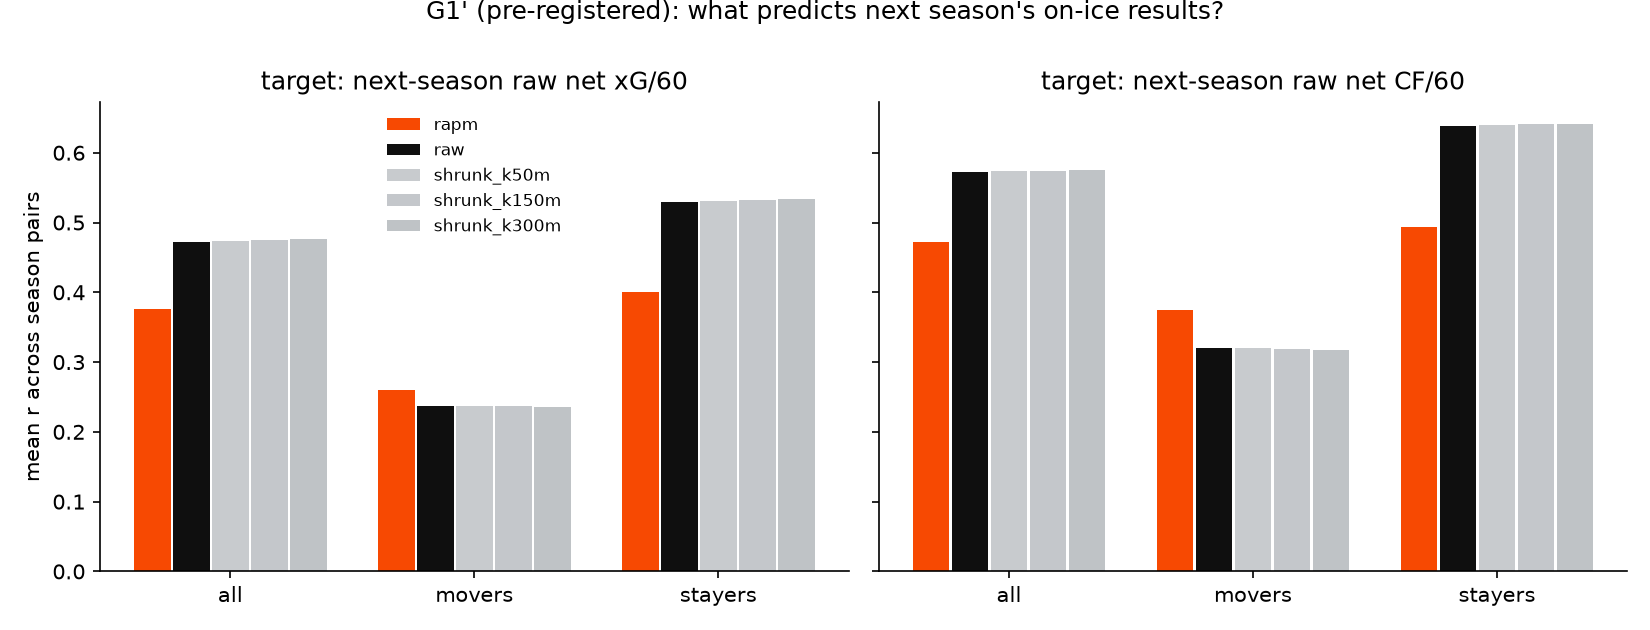
That is the whole case for the number, stated at its true size: modest signal that pays rent exactly when context changes. It ships as a three-season pooled figure, with shot volume given at least as much prominence as shot quality, because volume is measured considerably better (0.701 vs 0.497 pooled reliability). Single-season xG-RAPM is not shipped as a skill claim at all.
The promotion — and the bar it failed
On 20 July 2026 the joint fit's identity-blind structural half replaced v1 as the canonical model. That is the half with no player terms in it at all — the structure as re-estimated once the people were accounted for separately. The player-aware composite was not a candidate: put it in the tables and finishing stops being measurable, and it would double-count against the modeled shooting columns that ship alongside it.
The pre-registered bar was the same one everything else in this post was held to: beat the incumbent's held-out log-loss on the most recent season by 5×10⁻⁴, and improve in a majority of seasons. It failed both halves — +2.83×10⁻⁴, better in 5 of 16 seasons. It shipped anyway, as a recorded owner over-rule. Here is the case, including the parts that argue against it.
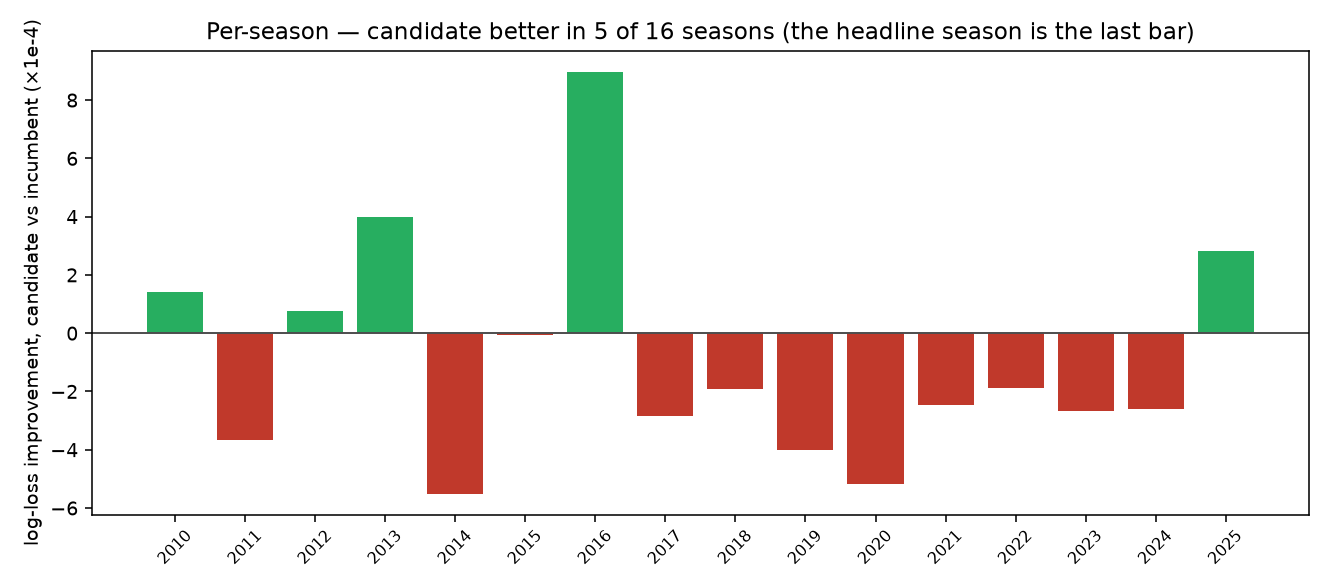
The interesting part is why it lost, because the naive comparison confounds three separate changes. Each can be isolated by comparing a different pair of models on the identical 2,344,674 shots:
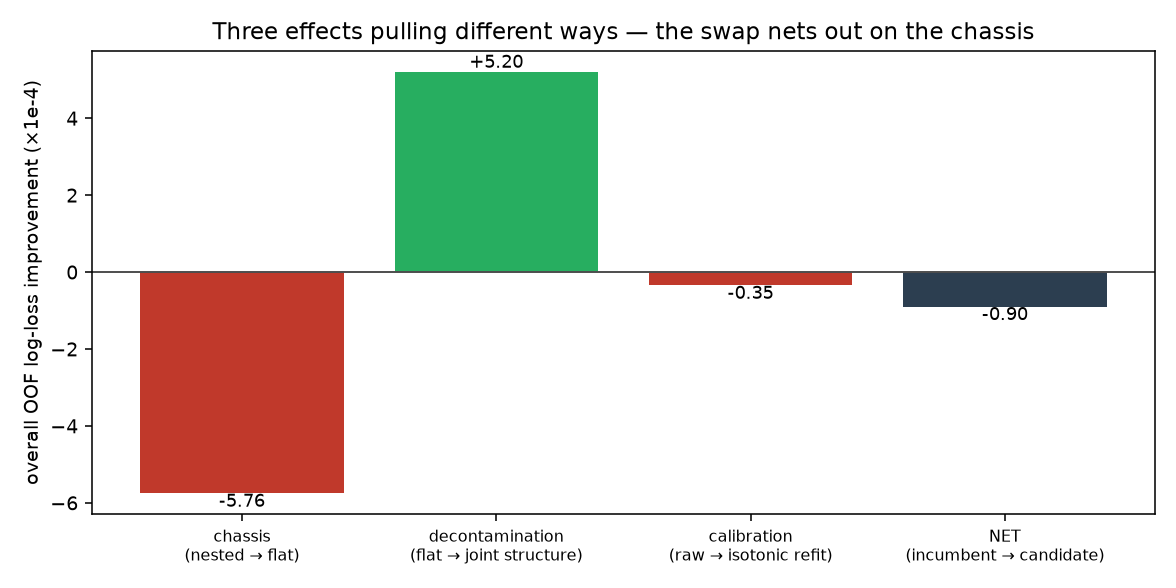
So the swap loses on architecture, not on the thing it was adopted for. That also says exactly where the outright win is — a nested backfit — which does not exist and is now the registered next question. (It was built five days later and it won — though not for the reason predicted here: Model v3.)
The read that actually decided it
None of the above is what settled the decision. This was: the structural model had been shipping uncalibrated, and nobody had noticed, because until now it was only ever consumed one shot at a time.
The joint fit's export correctly strips the composite's calibrator — that calibrator maps a different quantity — but never refit a replacement. Harmless for a per-shot surface. Not harmless for a canonical xG, whose main job on this site is to be summed. A level error in a summed xGF lands directly in goals-minus-xG and reads as league-wide finishing talent that does not exist. On the earlier structural export the deficit was 3.32% — roughly 3,700 phantom goals of leaguewide "finishing" across the corpus, which would have double-counted straight into the modeled shooting column shipping in the same week.
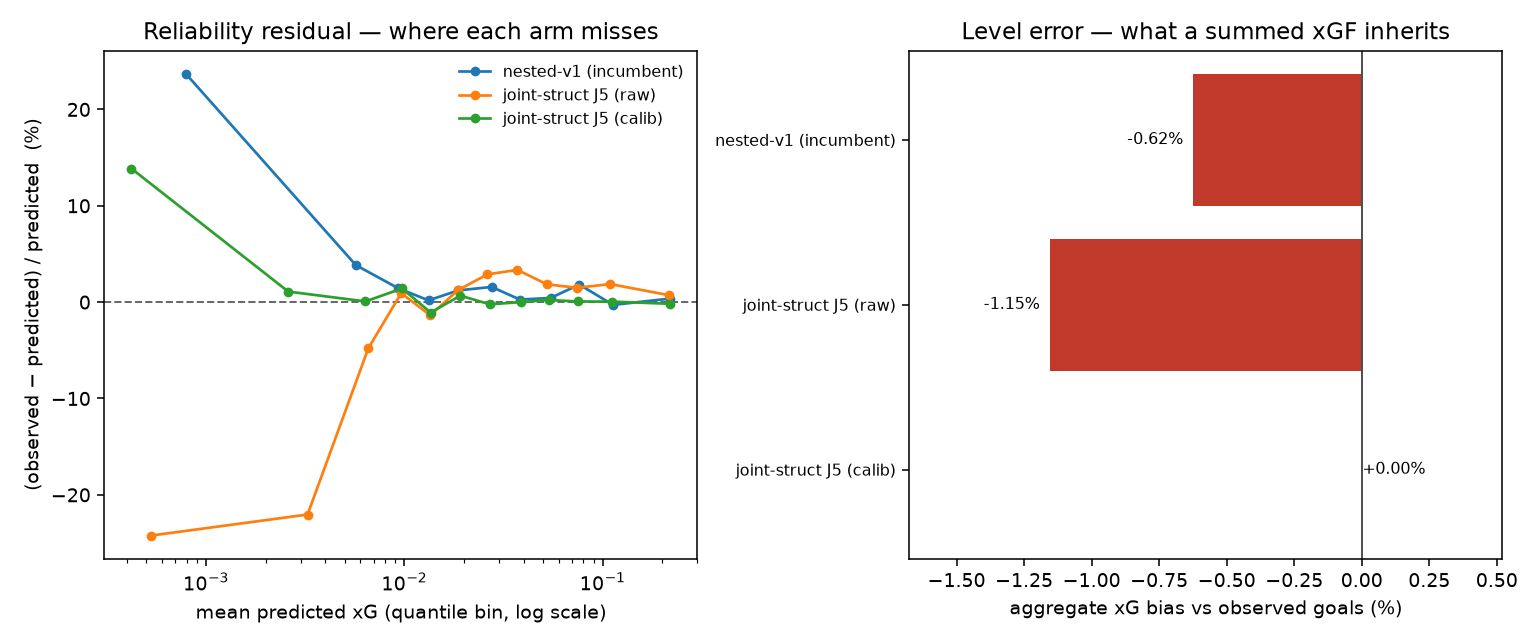
What the new model wins: calibration outright, the most recent season, and danger AUC (by a hair). What it loses, carried openly rather than argued away: pooled log-loss across all seasons, and 0.0022 of overall AUC. That last one is structural and permanent — calibration is monotone, so it cannot reorder shots, and no future calibrator will recover it. If this site ever leans on per-shot ranking as a product, that decision deserves re-reading.
Two practical notes. The standings do not move: 5v5 xGF% correlates 0.9991 between old and new across all 494 team-seasons, with a maximum shift of half a percentage point. And the real motivation was coherence — RAPM, player value, the player cards and the team talent ledger were already keyed to the joint lineage, so promoting the structural model collapses two model keys into one. Every surface on the site now reads from a single converged fit instead of two whose relationship needed a caveat.
What v2 changed, and what it didn't
The scoreboard is still talent-blind. That is the thing to hold onto. The canonical model changed identity — it is now v2's structural half rather than v1 — but not character: it has no player terms, so finishing remains measurable against it. v2's player-aware output stays what it always was, a set of ratings surfaces beside the scoreboard: the modeled-talent ledger on team pages, the finishing and saving strips on player cards, the RAPM usage and context panel.
Some things to keep in mind when reading any of it:
- The ratings measure quality per attempt only. A rating is a piece of player value, never the whole of it.
- RAPM is 5v5, both goalies on the ice. No power play, no penalty kill, nothing about penalties drawn or taken. Those are missing buckets, not errors — but they are missing.
- Defense is measured much worse than offense, roughly half the reliability, in both estimators. Treat a defensive number as the softer claim it is.
- A low-minutes player pinned near zero means "not enough evidence," never "confirmed average."
- The shipped ratings artifact is a final refit on all rows, labeled in-sample — the held-out numbers in this post are the honest evaluation, not the displayed values.