
NYI 2 – 5 NYR
New York Islanders at New York Rangers

2026-27 · regular season
2.33–3.38
Strength and score are read from NYI's side, the same minutes at both ends: PP = NYI power play · PK = NYR power play · Leading = NYI ahead · ST = each club's own power play.
NYI attacks◀ all strengths
How to read this map
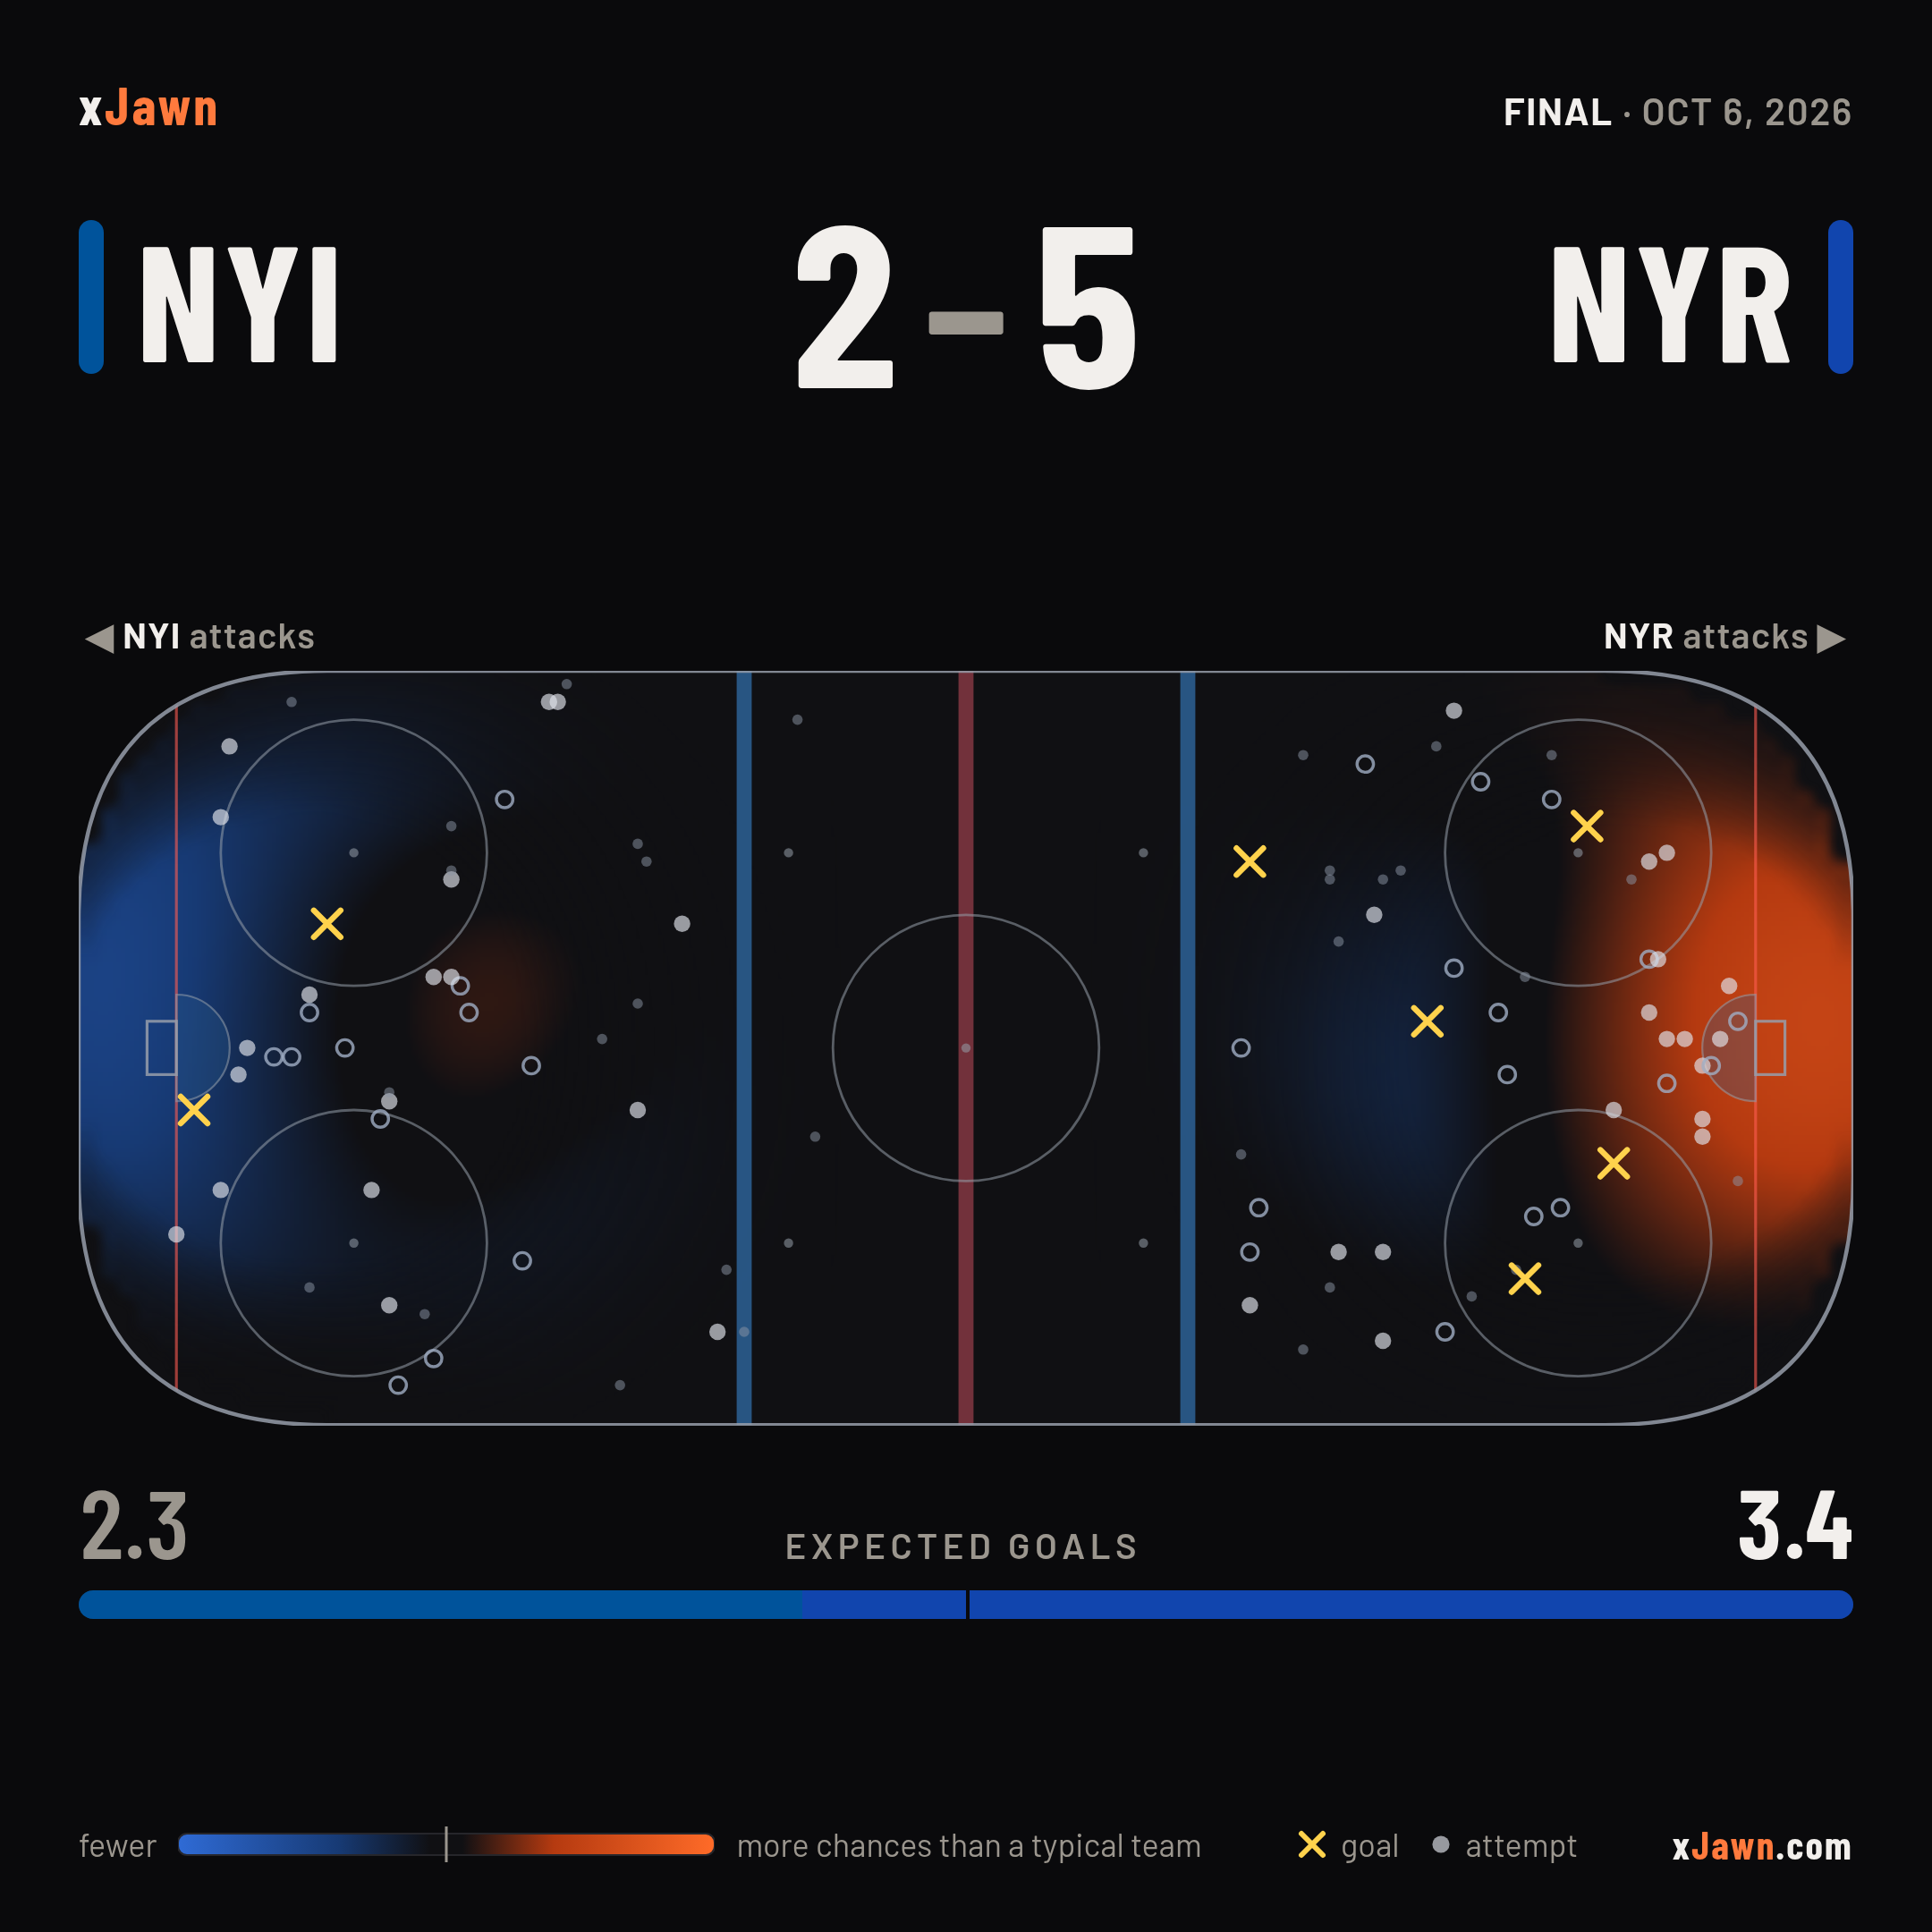
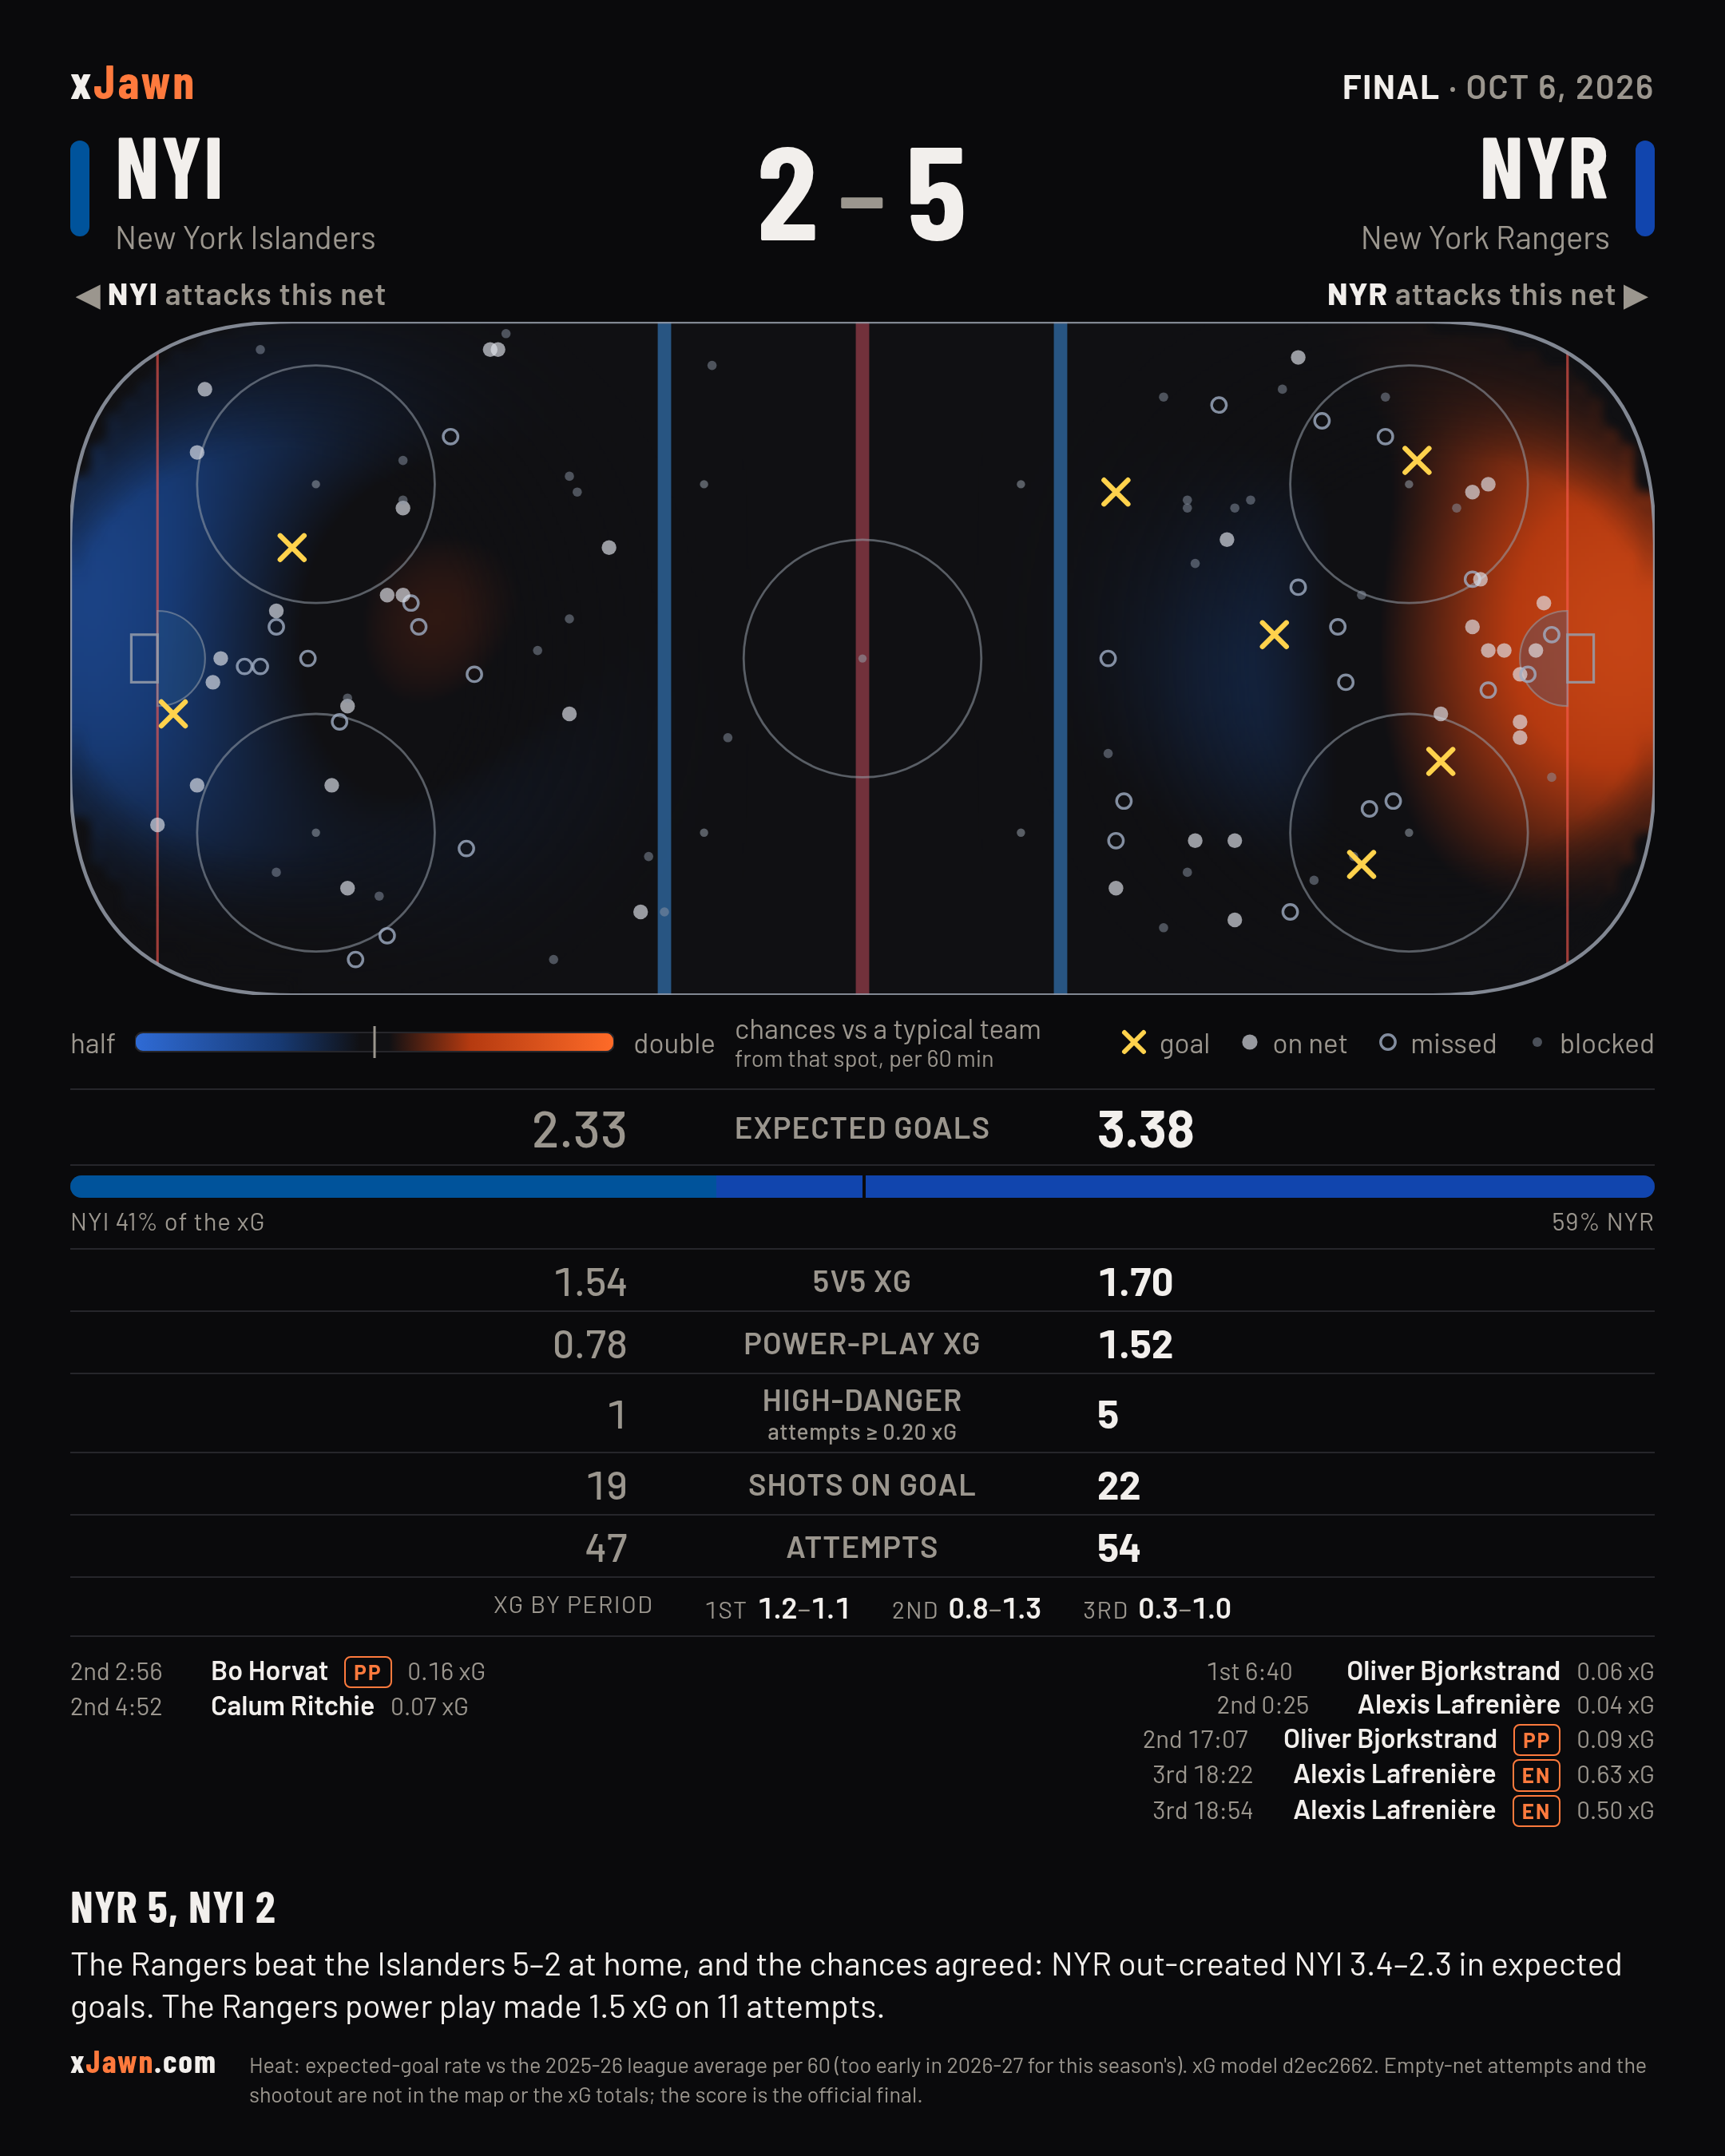
One rink, both teams: NYI attacks the left net, NYR the right. Every attempt is a Gaussian bump of height = its model xG. The controls switch the surface (xG heatmap ↔ vs league) and the markers; vs league compares this game against a typical NHL team-game under the same filter (2025-26 regular season, 1312 games), so a 5v5 view is measured against league 5v5.
A strength or score filter is read from NYI's side and mirrored for NYR: “NYI PP” shows NYI's power-play attempts on the left and NYR's shorthanded attempts on the right — the same minutes of the game at both ends. Empty-net attempts are excluded unless you include them. The Player control narrows the map and the rows beneath it to the attempts by either club while one player was on the ice (for a goalie, while he was in net); his own attempts wear a blue ring. vs league switches off while a player is picked — the league baseline is a whole team-game, which one player's slice is not. Hover any attempt for the shooter, the result, its xG, and the inputs behind it: clock, strength, score, shot type, distance, angle, handedness, rush/rebound, what happened just before, and the goalie or the blocker.
What each side produced
all strengths · regular seasonThe Rangers beat the Islanders 5–2 at home, and the chances agreed: NYR out-created NYI 3.4–2.3 in expected goals. The Rangers power play made 1.5 xG on 11 attempts.
Counts come from the shot table behind the map: empty-net attempts and the shootout are excluded, so the goals here can trail the official final by an empty-netter or the shootout's deciding goal. Same numbers as the post-game cards.
As the game went
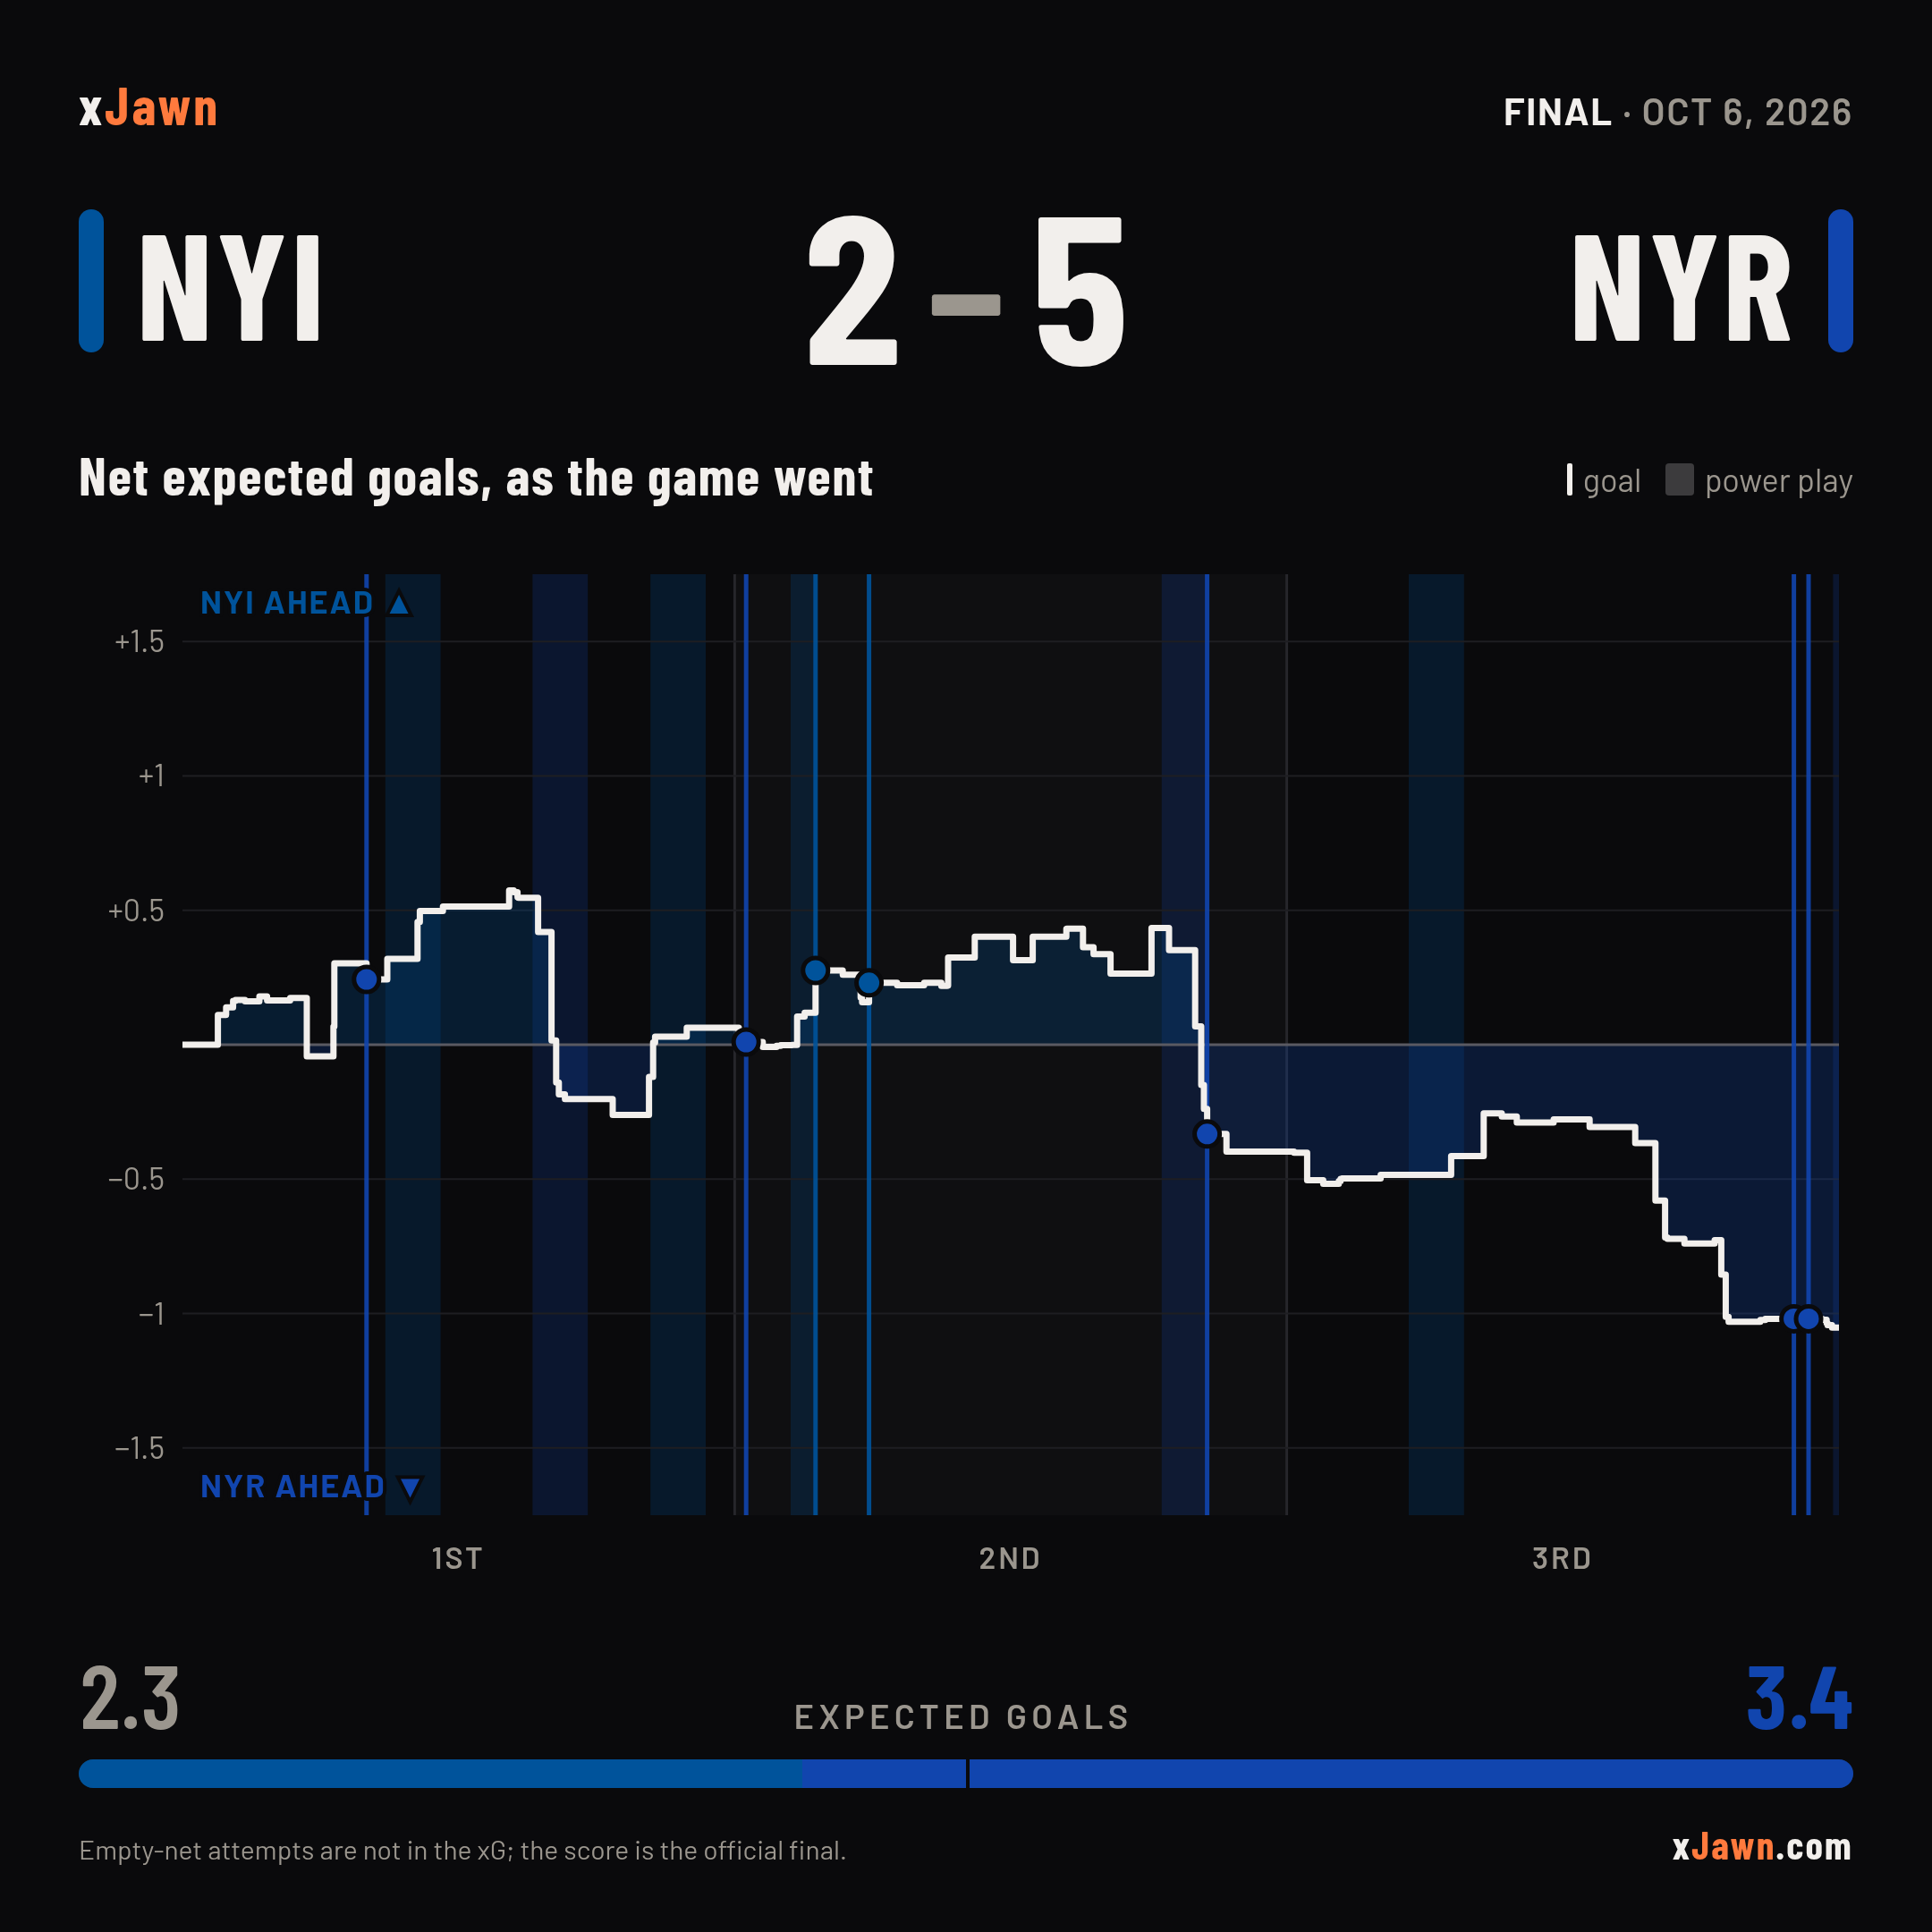
cumulative NYI − NYR xG · bands = power plays · lines = goalsHow to read this
One line: cumulative NYI minus NYR expected goals. Above zero NYI is ahead on chances, below zero NYR is. Shaded bands are power plays in the side's colour; vertical lines are goals.
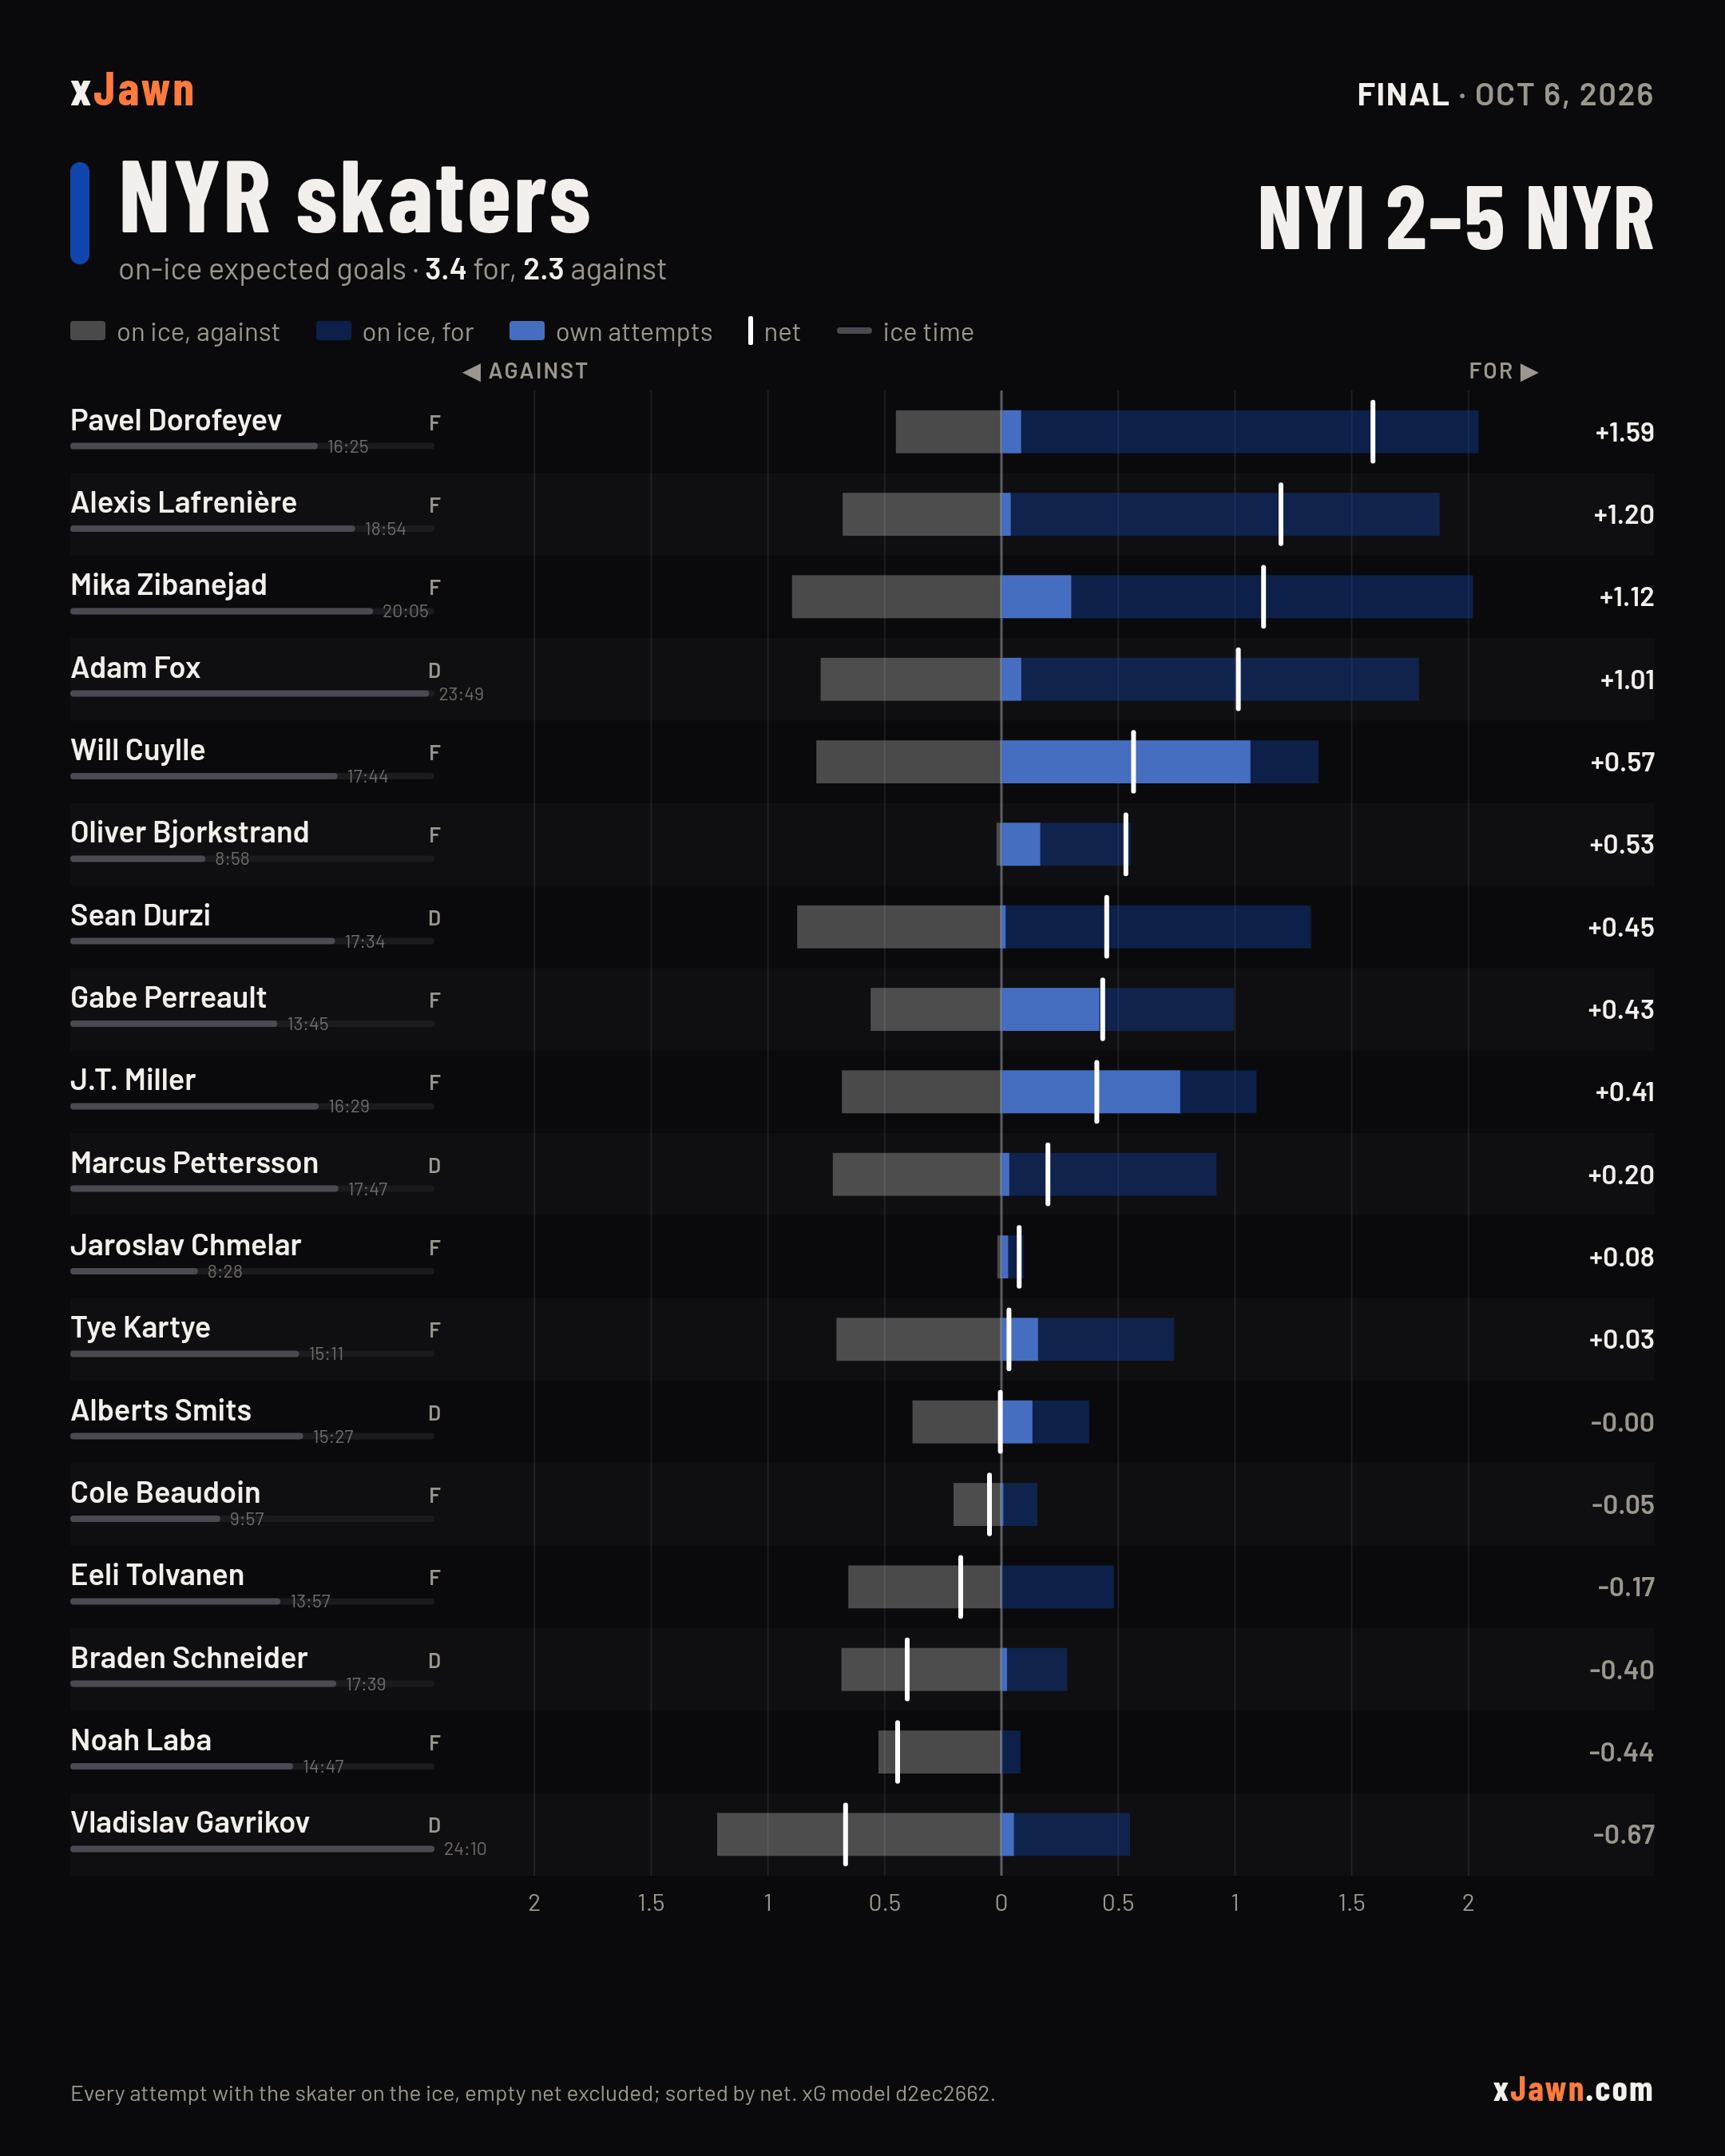
Skaters
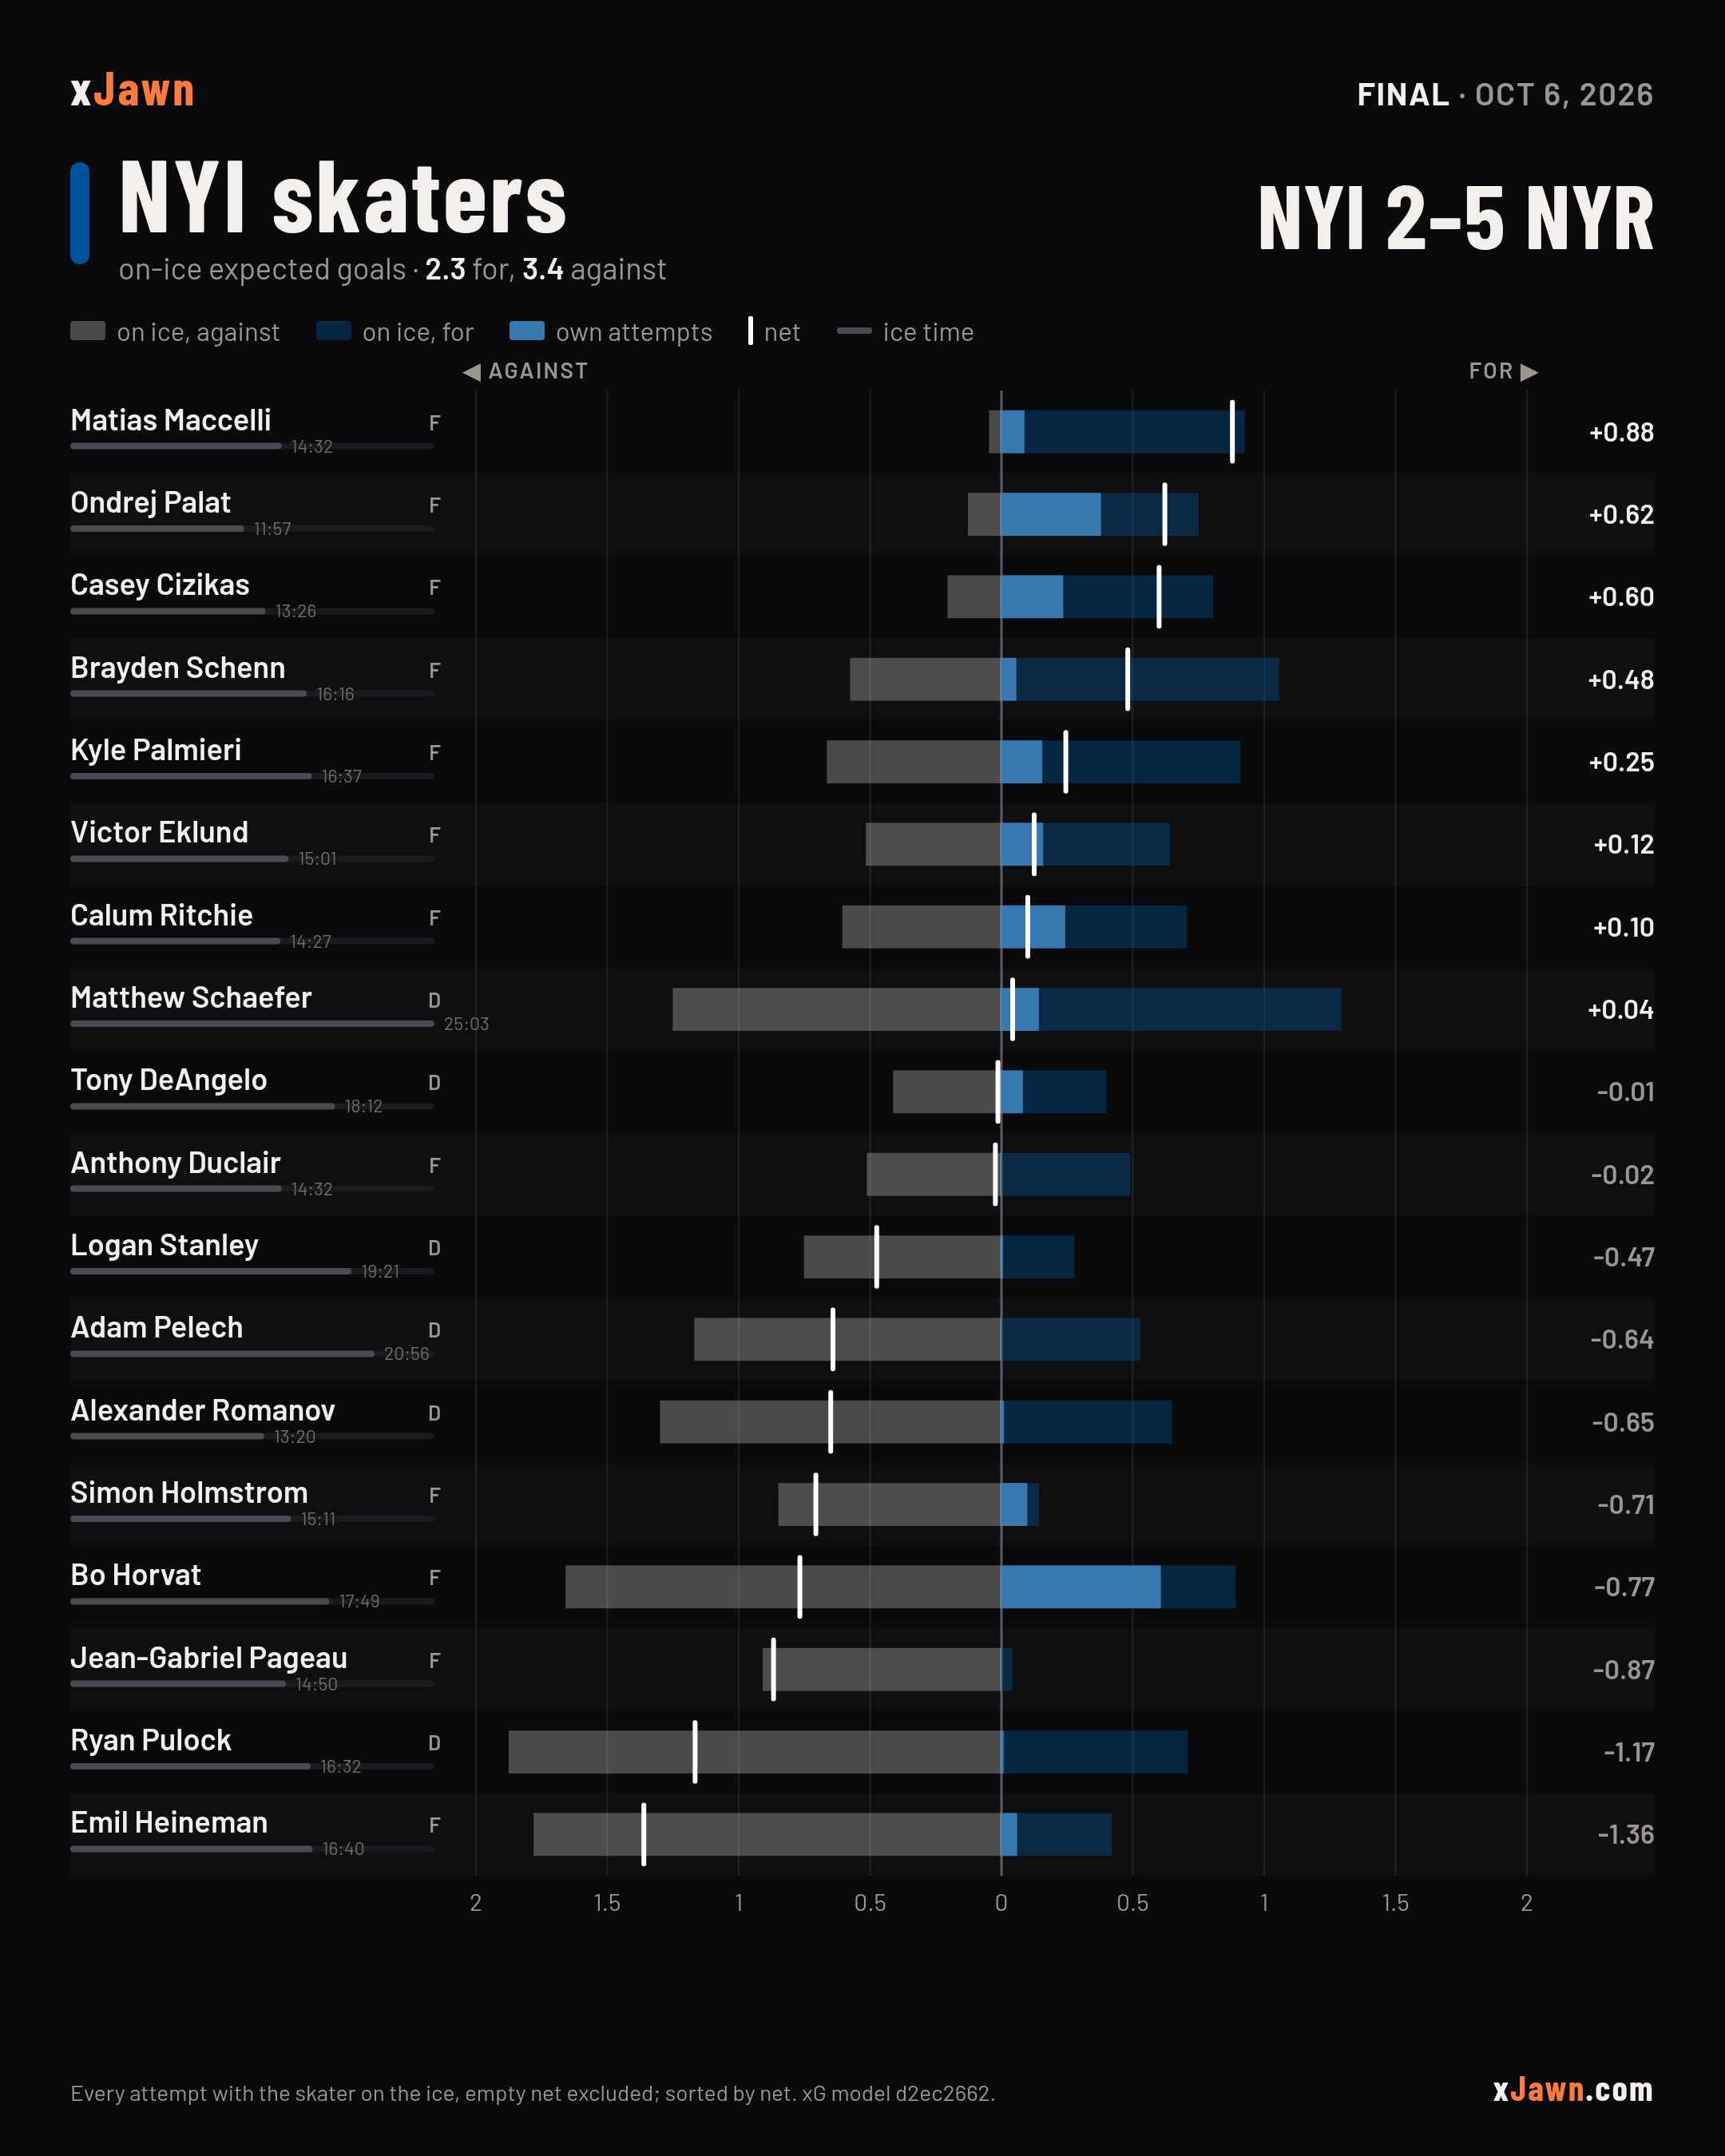
on-ice xG · sorted by net · one gameHow to read this
Every skater, sorted by net on-ice expected goals: on-ice xG against to the left of zero, for to the right, his own attempts as the solid bar, a hash at the net. The slim track under the name is ice time.
NYI
NYR
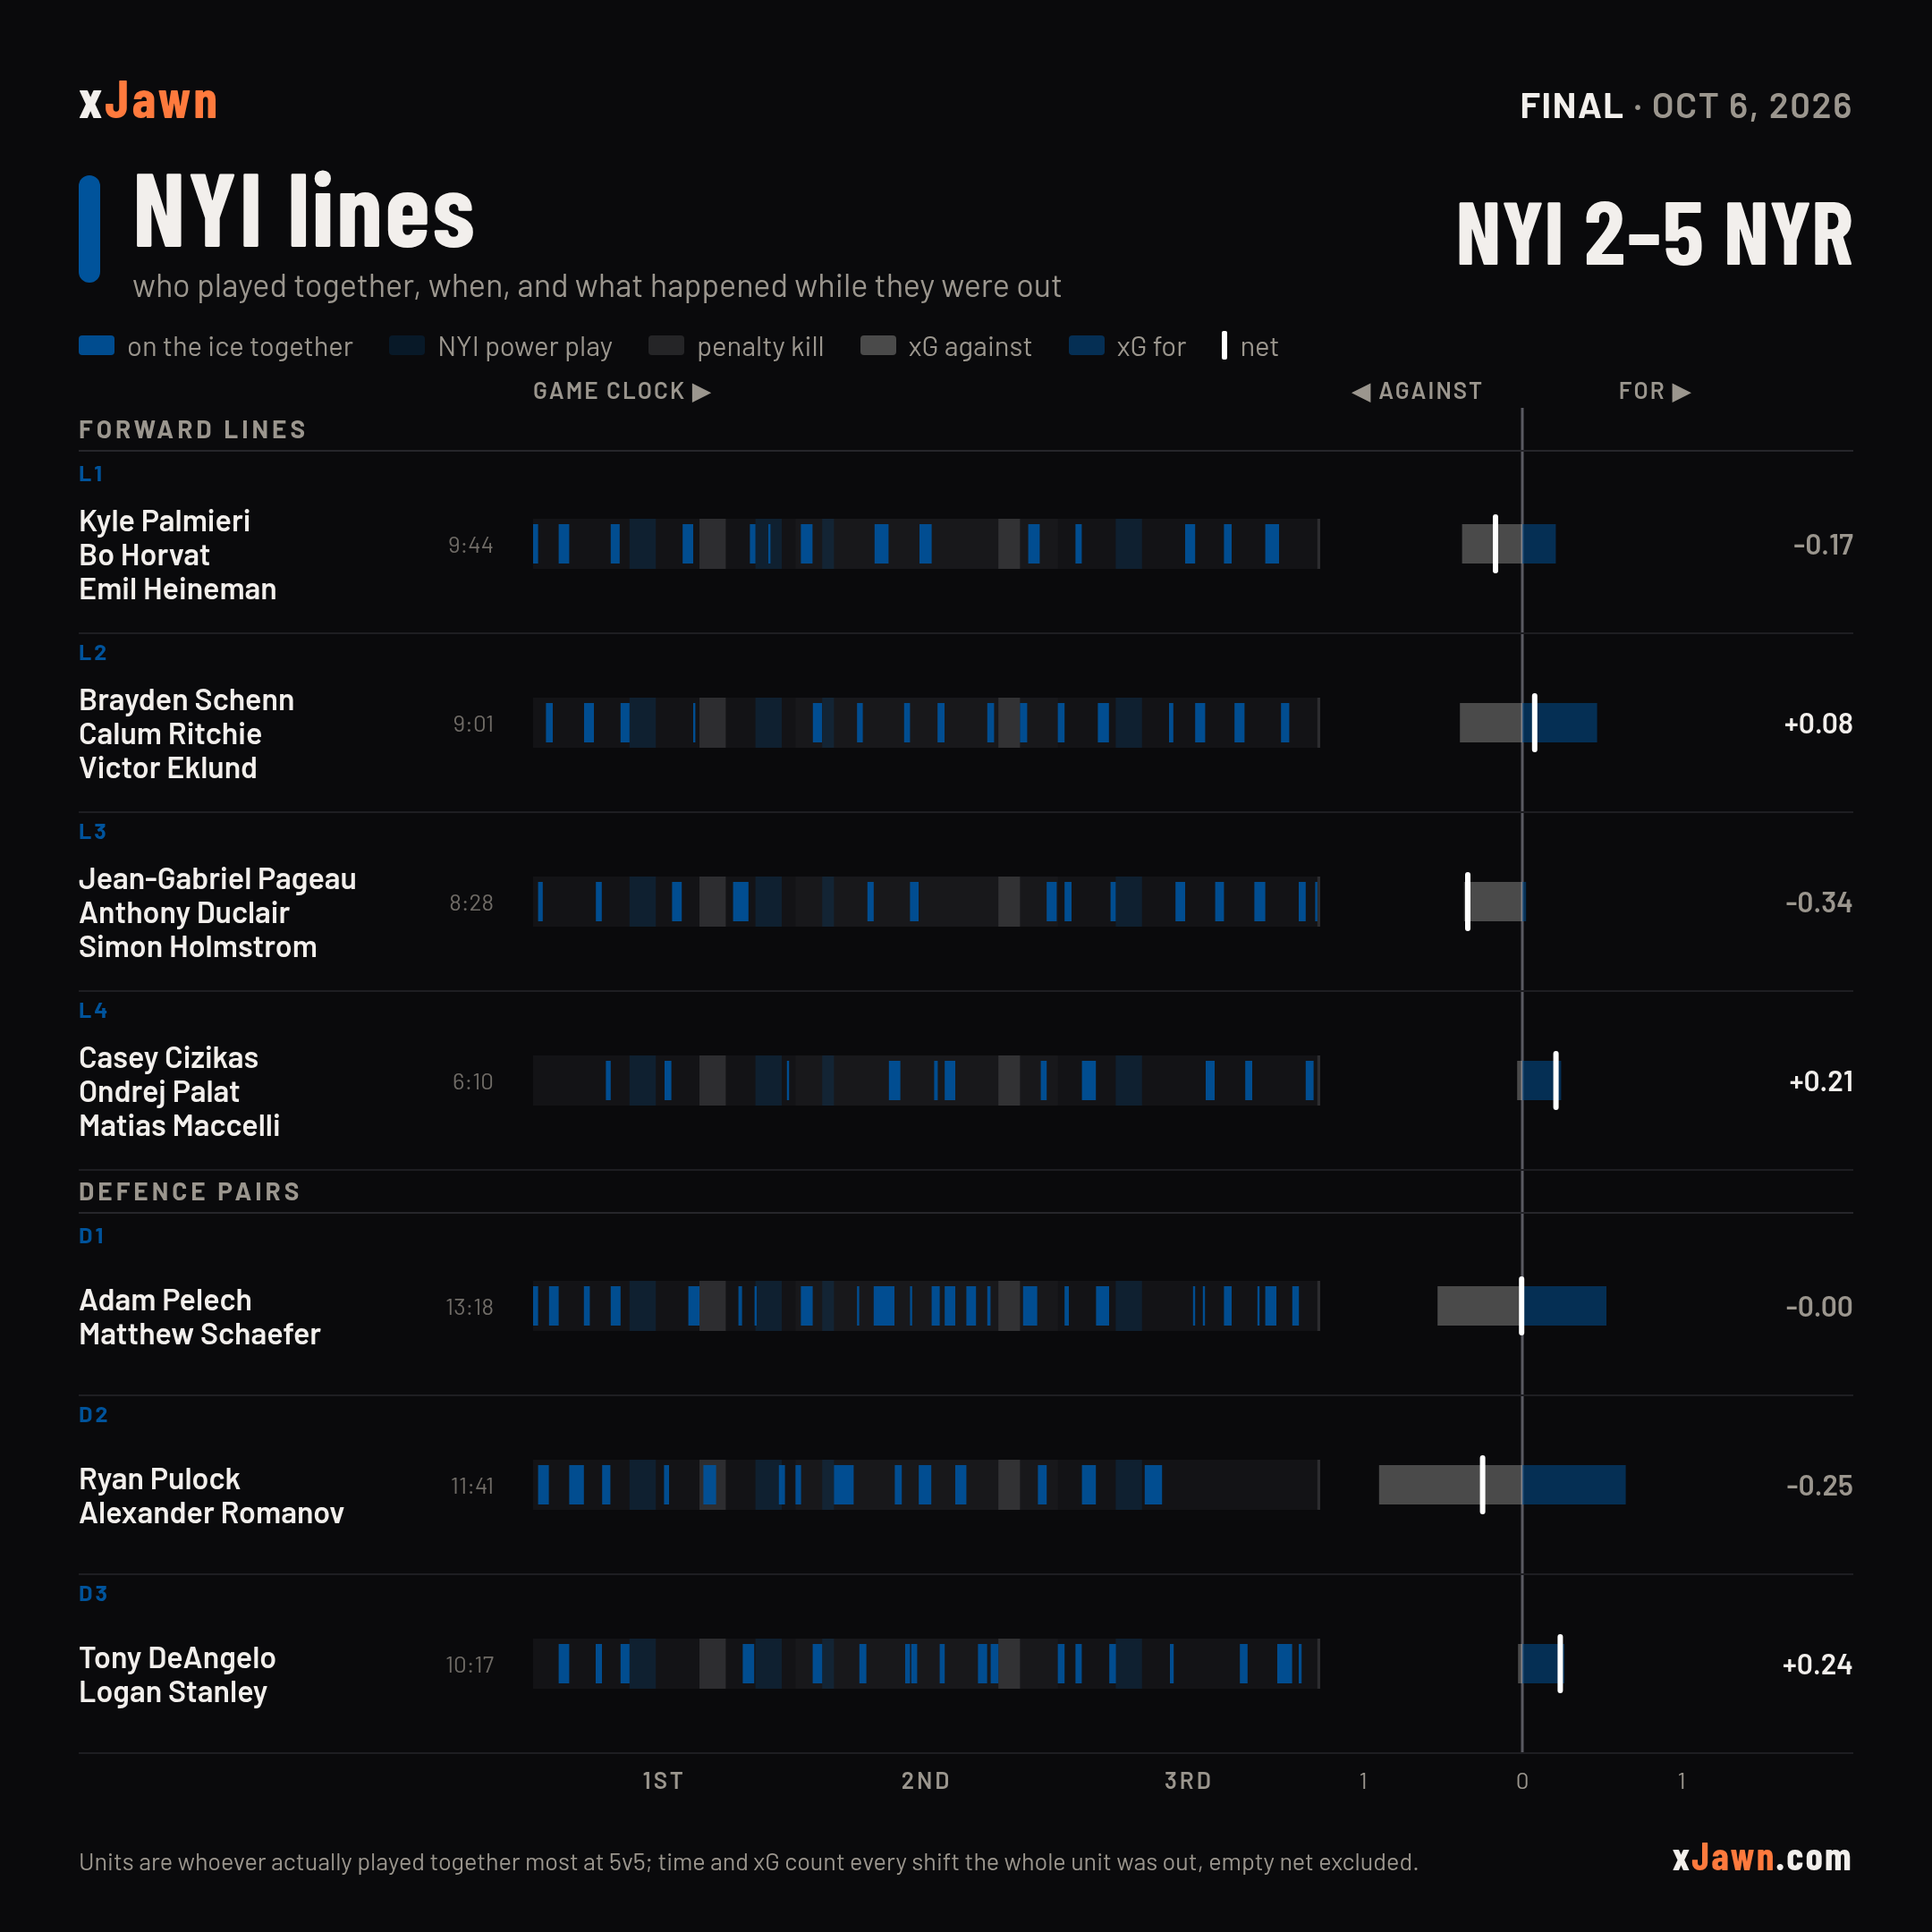
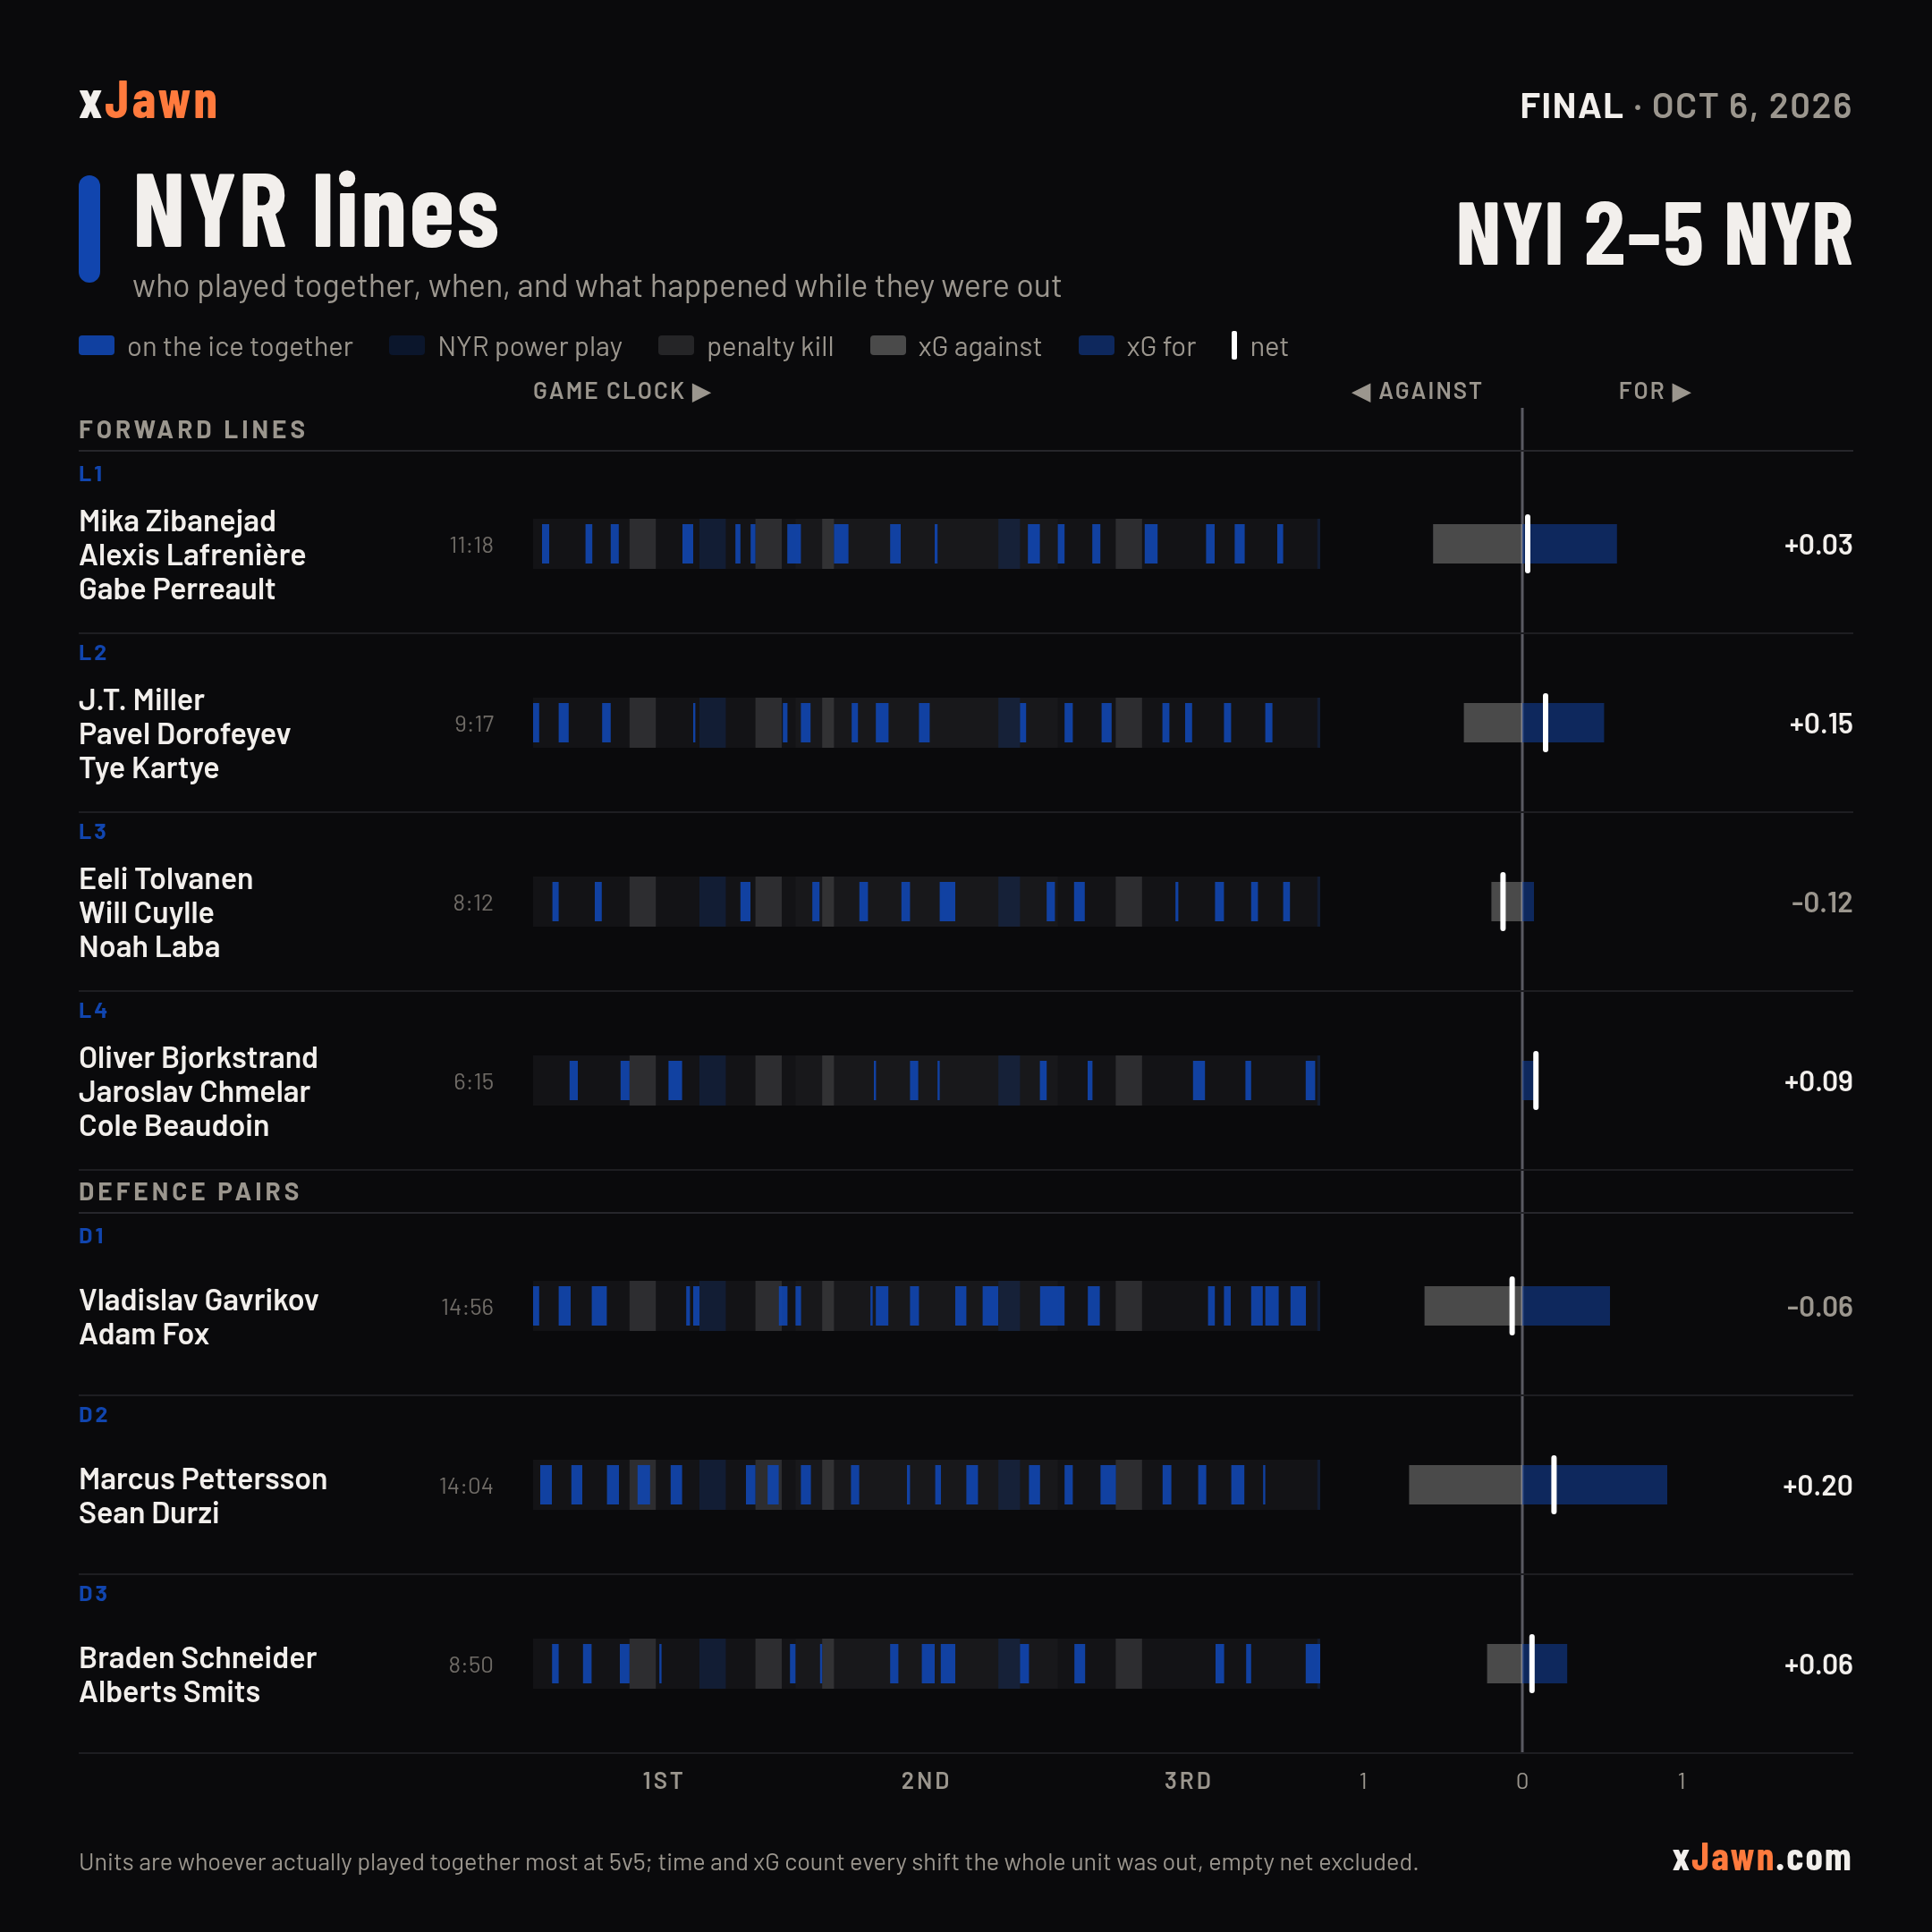
Lines & pairs
most-used 5v5 units · when they played · on-ice xGHow to read this
The forward lines and defence pairs that actually played together most at 5v5, each with when it was on the ice across the game clock (period and power-play bands behind the strip) and on-ice xG against/for while the whole unit was out.
NYI
NYR
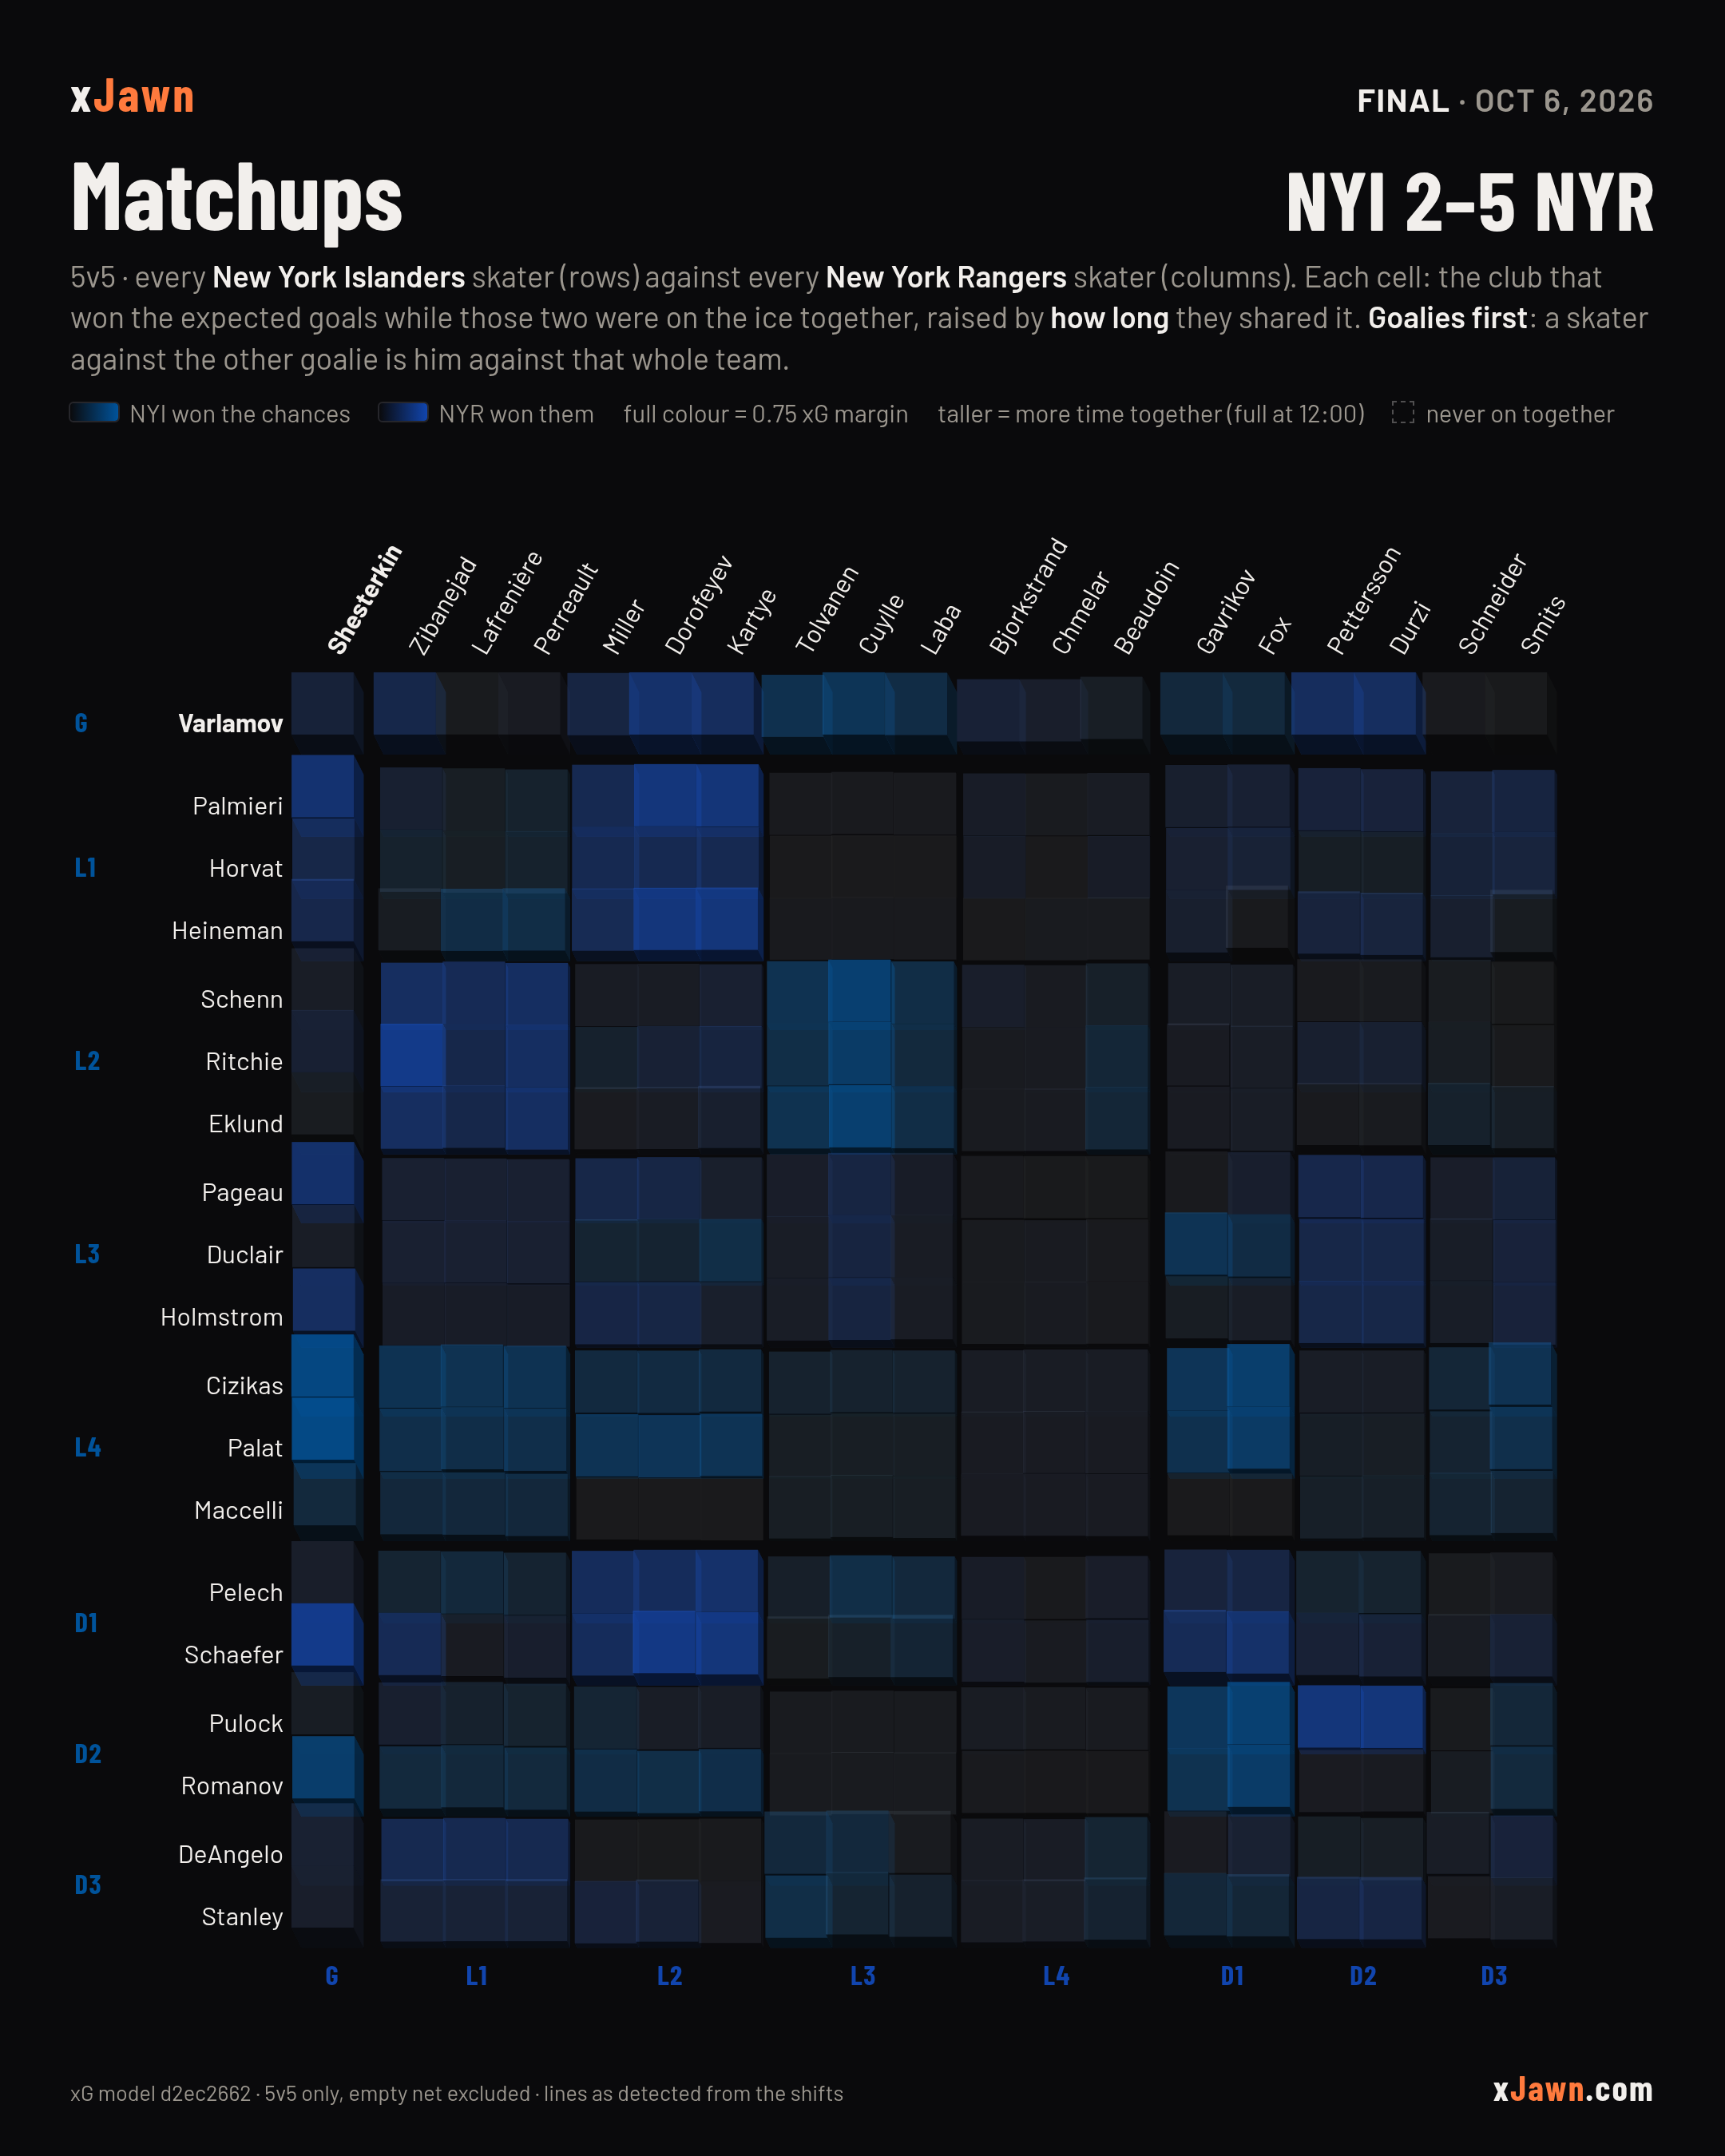
Matchups
5v5 · every skater against every skater, goalies first · hover a cellHow to read this
Rows are NYI's skaters, columns NYR's, grouped the way they played: forward lines (L1 = the line that played together most), then defence pairs. Each cell covers the five-on-five time those two players shared the ice. Its colour is the club that out-chanced the other in that time — expected goals for minus against — and the stronger the colour, the bigger the margin. Each cell is also raised: the taller the block, the longer the two shared the ice, up to full height at 12:00 of five-on-five time. A grey cell means they met and it came out even; an open, flat one means they never met at five-on-five.
The first row and column are the goalies. A goalie is in net for every five-on-five second, so a skater's cell against the other side's goalie is all of that skater's five-on-five time against that team — the rest of his row or column added up — and the corner where the two goalies meet is the game's five-on-five. Those cells cover far more time than any pair, so they reach full colour sooner and stand at full height, a wall along each edge of the grid. A goalie change adds a second goalie row or column, each covering his own time.
Linemates share the ice, so a line against a line reads as a block. The margin is a total, not a rate: a long matchup has room to build a big gap and a thirty-second one does not — which is what the height is there to show: a tall, strong cell is the game's story; a short, strong one is a moment. Hover (or tap) any cell for the exact time together, the xG each way, attempts and goals. One game — a strong cell is what happened, not what would happen again.
Goals
xG = the chance, before it went in| Team | Scorer | Period | Time | xG | |
|---|---|---|---|---|---|
| NYI | Bo Horvat | 2nd | 2:56 | PP | 0.16 |
| NYI | Calum Ritchie | 2nd | 4:52 | 0.07 | |
| NYR | Oliver Bjorkstrand | 1st | 6:40 | 0.06 | |
| NYR | Alexis Lafrenière | 2nd | 0:25 | 0.04 | |
| NYR | Oliver Bjorkstrand | 2nd | 17:07 | PP | 0.09 |
| NYR | Alexis Lafrenière | 3rd | 18:22 | EN | 0.63 |
| NYR | Alexis Lafrenière | 3rd | 18:54 | EN | 0.50 |
The prediction, scored
Before puck drop the engine made NYR a 56.2% favorite, expecting a 2.68–3.05 game — NYR won 2–5, so the call landed. Every number in this section was issued before the game and is never re-graded.
| pred. xG | actual xG | pred. 5v5 | actual 5v5 | pred. ST | actual PP | |
|---|---|---|---|---|---|---|
| NYI | 2.68 | 2.33 | 1.95 | 1.54 | 0.59 | 0.78 |
| NYR | 3.05 | 3.38 | 2.02 | 1.70 | 0.99 | 1.52 |
Predicted 5v5 / special-teams portions come from the predicted map's strength splits (one shared scale per team pins the all-strengths total to its expected goals), so they don't sum exactly — the remainder is 4v4, 3v3, and other mixed states. The actual columns are the card's own counts (empty-net attempts excluded); the actual PP column is power-play xG only, the same bucket the predicted map's special-teams view draws.
The pregame score grid
The likeliest finals the engine saw before the game, with what actually happened marked — ■ NYI · ■ NYR.
| Likeliest finals (NYI–NYR) | probability | |
|---|---|---|
| 2–2 | 7.7% | tied after regulation — OT/SO decides |
| 3–3 | 7.0% | tied after regulation — OT/SO decides |
| 2–4 | 4.4% | |
| 1–3 | 4.3% | |
| 1–1 | 3.8% | tied after regulation — OT/SO decides |
| 2–5 | 2.7% | what happened |
Scoreline odds are the engine's own grid: each team's goals as a Poisson count, with the fitted adjustment for how often games end tied after regulation (ρ = 0.35), so these odds and the headline win probability come from the same numbers. The OT/SO layer is a separate fitted model and is already inside the headline win probability.
The pregame read
The engine made NYR a 56.2% favorite — NYR controls 53.2% of the predicted xG. Of NYI's 2.68 expected goals, 1.95 should come at 5v5 and 0.59 on the power play; NYR projects 2.02 at 5v5 and 0.99 on the power play. The logistic challenger put the home side at 56.5%, Elo at 58.6%.
Where the engine expected the goals
The predicted surface, issued before puck drop — not this game's shots (those are the card's map above). NYI attacks the left net, NYR the right; each end multiplies where the attacking team generates xG this season by where its opponent concedes it, scaled so each end totals the engine's expected goals. Actual shots lays the game's unblocked attempts on top: × goals, • on net, ◦ missed.
Tale of the tape
How each team fares on its own, season to date: per-game xG rates with league rank (of 32). Rank 1 is best on every row — orange ranks sit in the top third of the league, gray in the bottom third.
| NYI | NYR | |
|---|---|---|
| 2.86 (16th) | Offense xG for / game |
2.82 (18th) |
| 2.84 (16th) | Defense xG against / game |
2.43 (6th) |
| 0.77 (15th) | Power play PP xG / game |
0.70 (20th) |
| 0.98 (26th) | Penalty kill PP xG conceded / game |
0.49 (5th) |
Season-to-date form as of the site's latest build, shown for context — the ratings the engine actually used were its own as-of-game-day state. Replay this matchup in the lab →