The (Royal) Road Not Taken
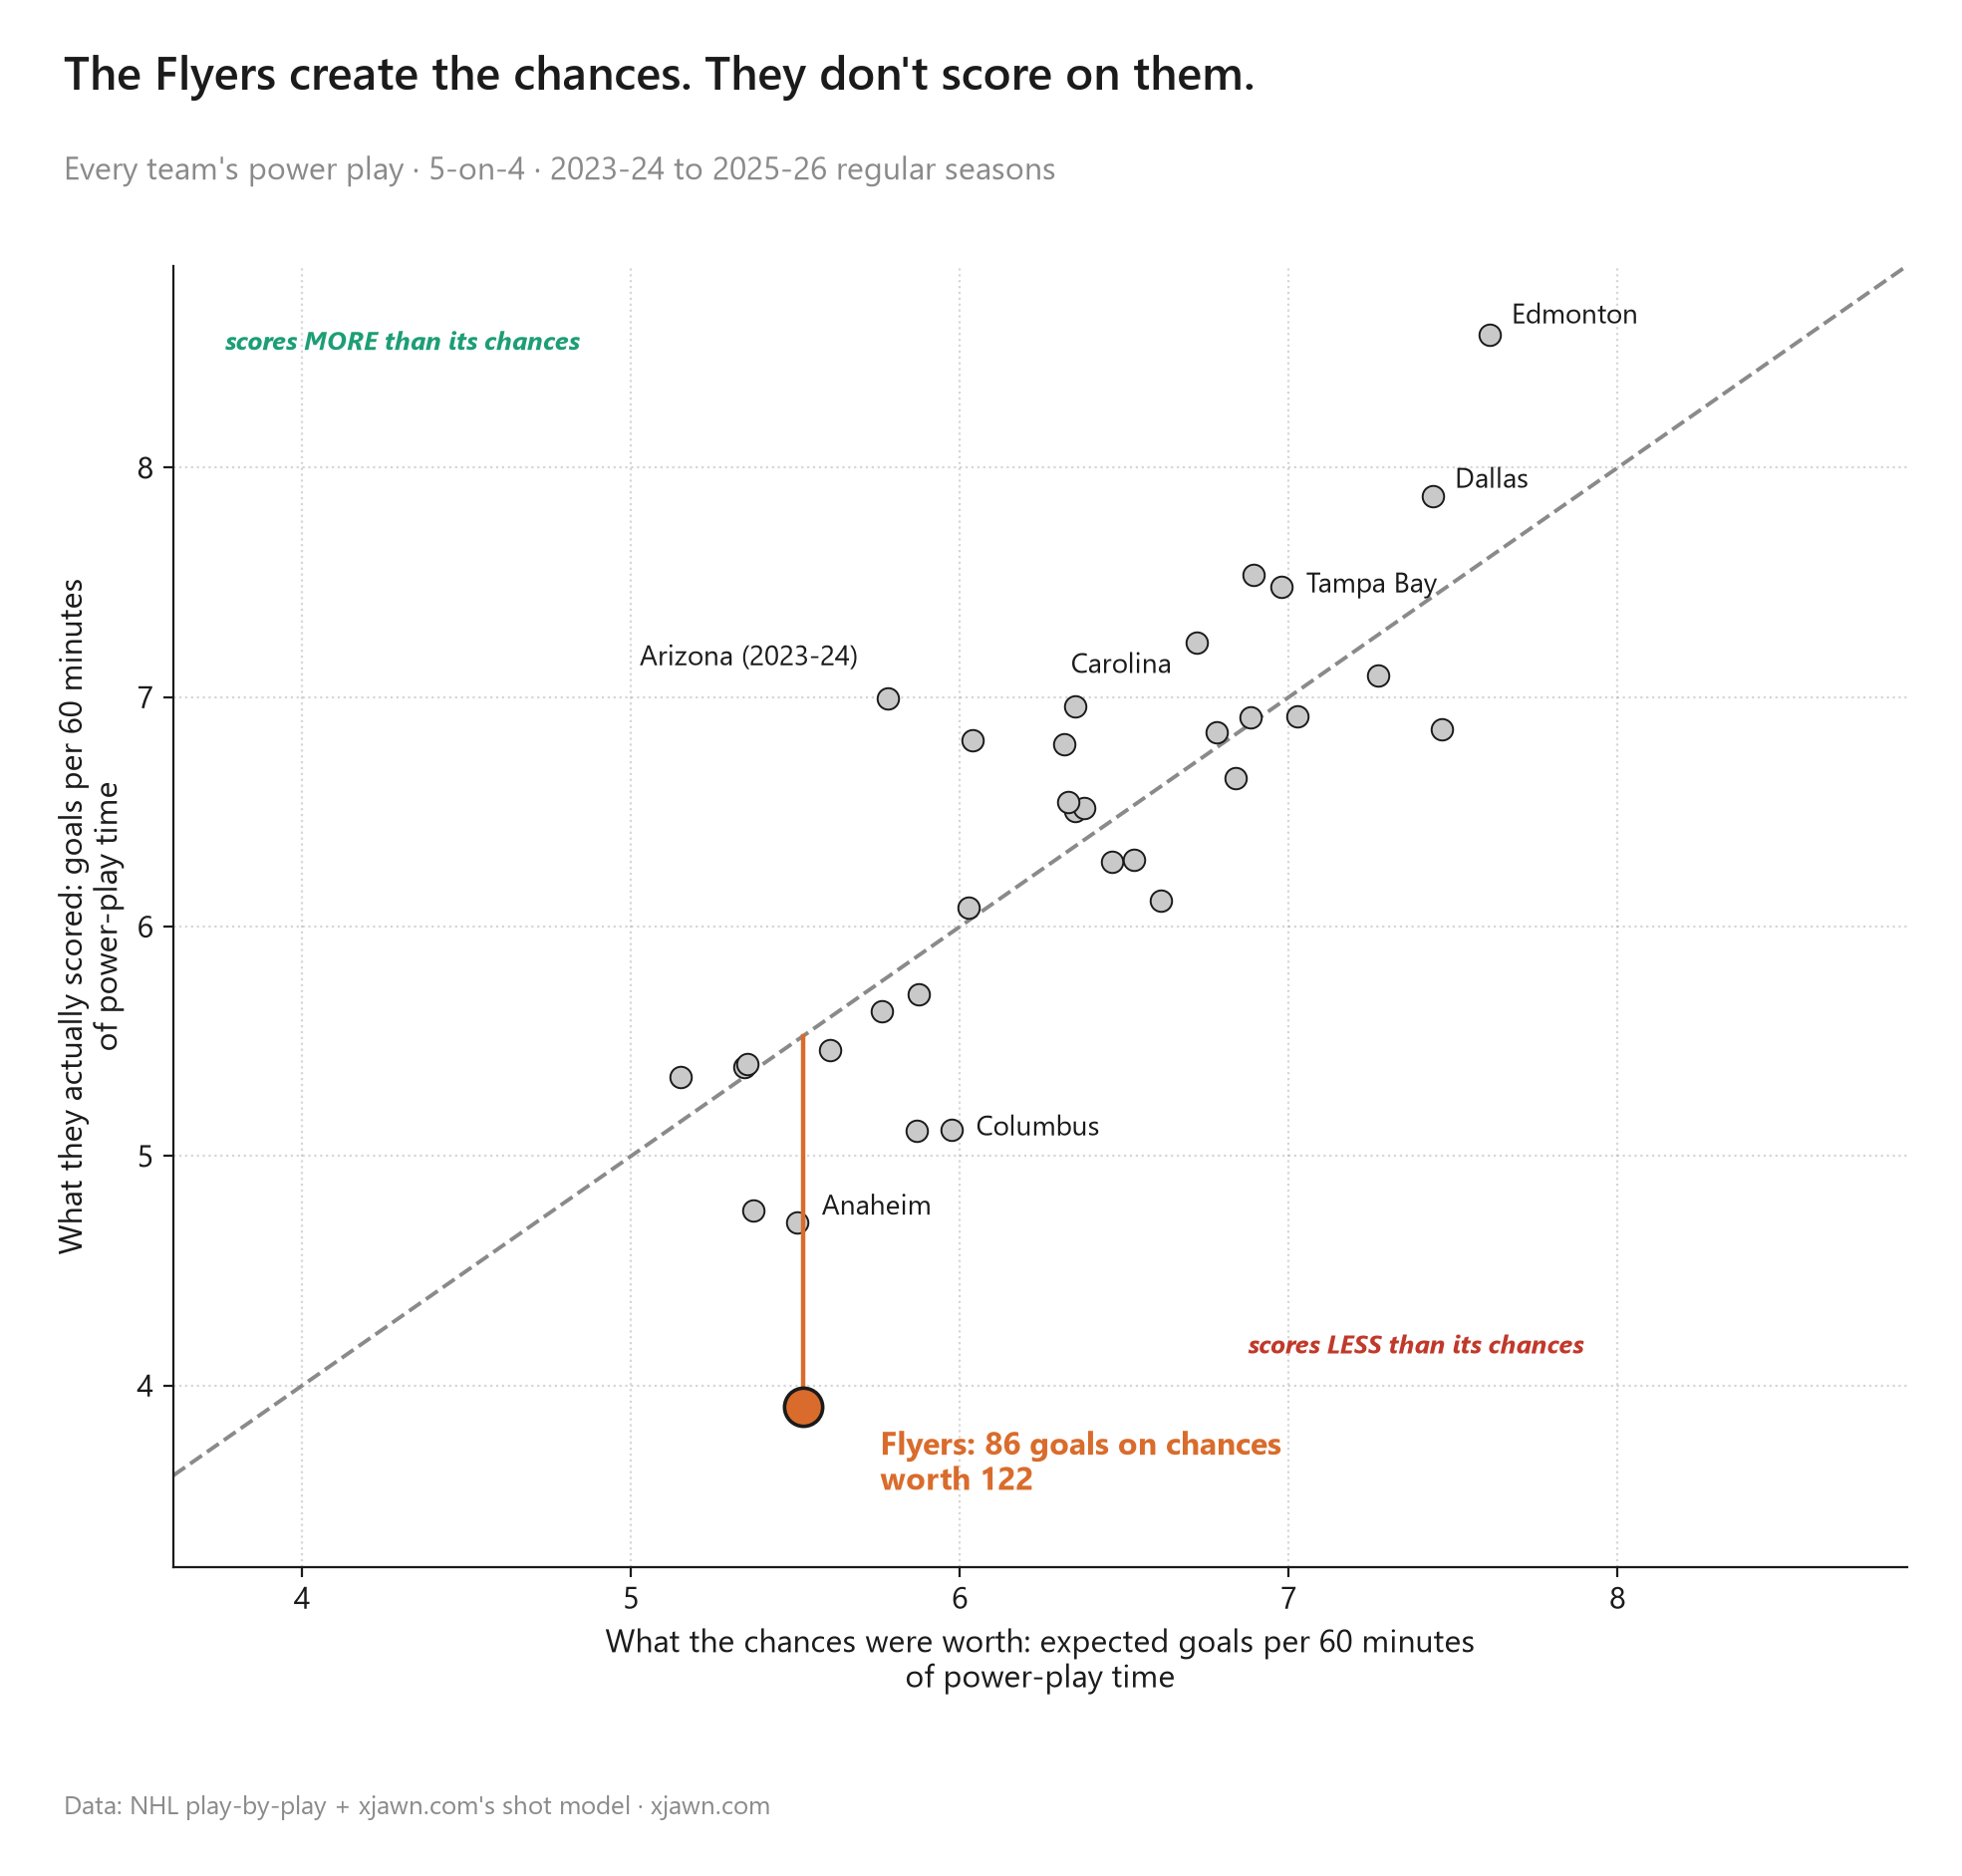
The Flyers' power play creates chances and does not finish them: 86 goals on chances worth 122 over three seasons, the worst gap in the league by double. The NHL's tracking data points at what is missing. Over those three seasons the Flyers scored seven power-play goals off a pass across the middle of the ice, second-fewest in the NHL.
The chances are there. The goals are not.
The Flyers power play has scored 3.9 goals per 60 minutes over the last three seasons. That is last in the league, and the median team isn't particularly close at 6.5.
The obvious guess is that they cannot create chances. While true in years past, last season showed signs of modest improvement. In 2023-24 and 2024-25 the Flyers created 5.1 and 4.7 expected goals per 60, 31st of 32 both years. In 2025-26 they created 6.8, eighth-best in the league.
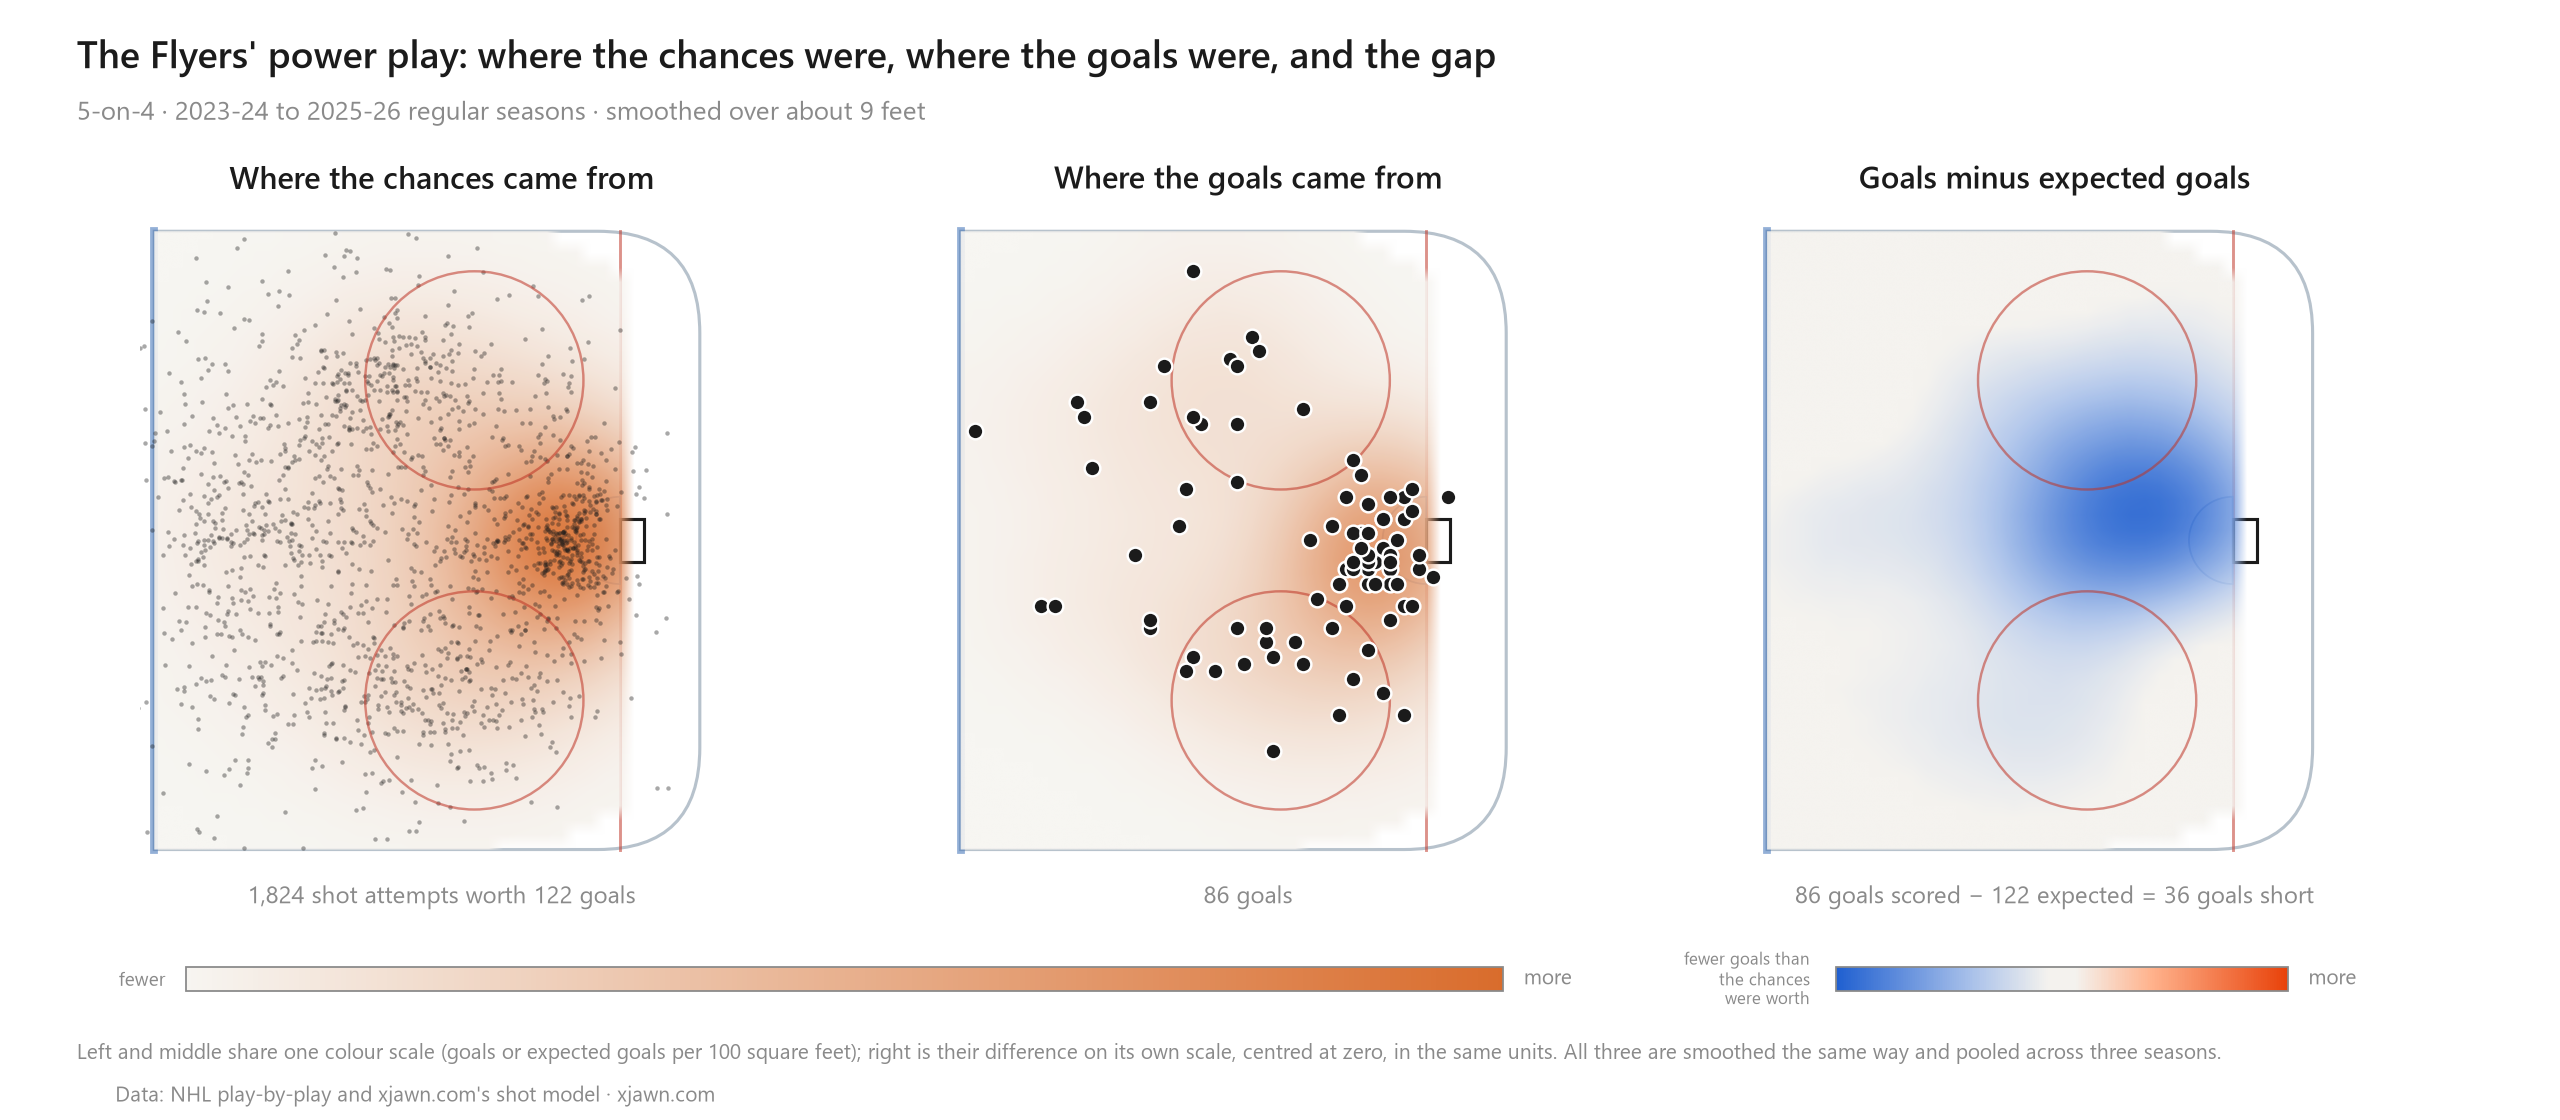
The goals (or the relative lack thereof) are the part that is extreme. Over three seasons the Flyers took 1,824 shot attempts worth 122 goals and only scored 86. No other team is close to that differential. The gap is twice the size of the next-worst team's, and if every one of those shots were a fair coin flip at its own odds, a gap this big would turn up about once in 3,300 tries. [2] It's not a fair coin flip.
Last season made it starker. In 2025-26 the chances got much better: 6.8 expected goals per 60, eighth-best in the league. The goals did not follow. They scored 33 on chances worth 49, 4.6 per 60, third-worst. That was the biggest gap between chances and goals of any team in the league that year, by a wide margin. The Flyers "fixed" (read: slightly improved) the "process" part of the power play people usually complain about, and it barely showed up on the scoreboard.
It's not that the shots get blocked or miss the net. Those rates are normal. It's that shots which reach the goalie go in 9.7% of the time, against 14.1% for the league.
Where and when the goals go missing offers further clues.
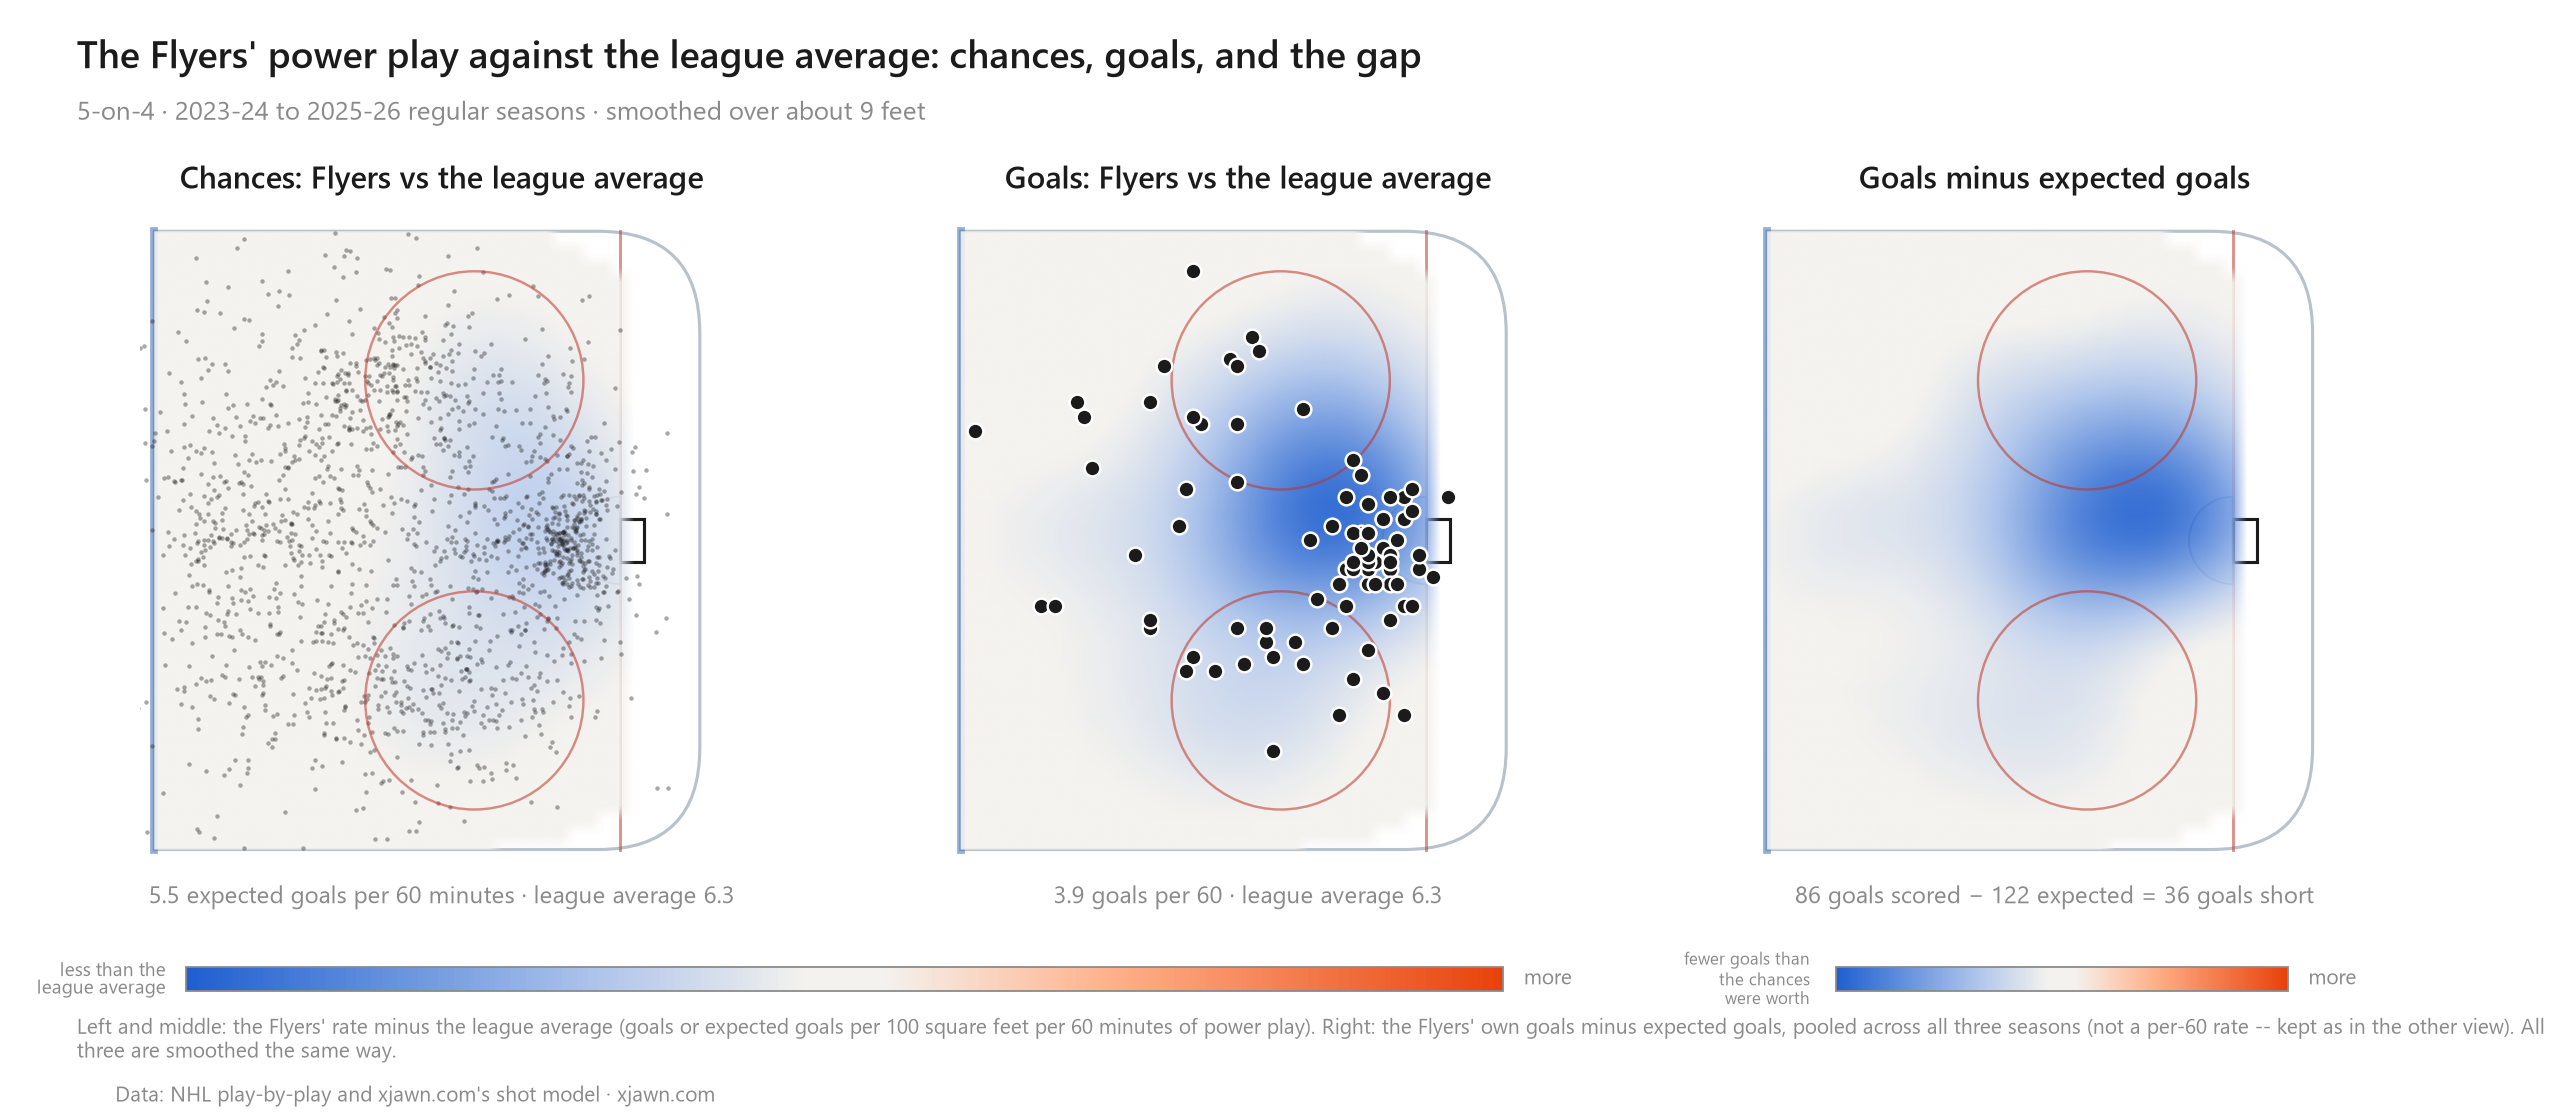
- It is not one spot on the ice. From every area, the Flyers score about two-thirds to three-quarters of what their chances are worth: 66% from the slot, 72% from the crease, 72% from the flank circles, 76% from the point. The slot carries the biggest count, 38 goals on chances worth 57, because that is where most chances are. But this is not a problem with one shooting spot or with shot selection. Whatever it is touches every shot. The maps show it against the league average: the chances are a shade below normal almost everywhere, and the goals are far below normal from the slot, the crease and both circles.
- They are missing on first shots, not second ones. On rebounds the Flyers finish fine (25 goals on chances worth 23). The entire gap is on shots that are not rebounds (61 on 99).
- It gets worse as the power play goes on. In the first 30 seconds of a power play they score 82% of what their chances are worth (26 goals on 32). After that it drops to 67% (60 on 90).
Good looks from everywhere, on the first shot, from a power play that has been set up for a while, and they do not go in.
There are two ways to explain that.
- The shooters are not good enough. That is part of it, and it is a different article. The short version: the Flyers' shooters do rate below average, but going by their track records that should cost the power play only a sliver of what it is actually losing [3]. And most of them, Tippett, Konecny, Foerster, Cates, finish fine at 5-on-5 and badly on the power play. Same hands, different result.
- The chances are not as dangerous as they look. A shot model sees where the shot came from. It does not see what happened before it. If the Flyers' shots arrive with the goalie already set and square, they are worse shots than the model thinks. That would explain the pattern above: it lowers every shot from every spot by the same mechanism, because a shot is only as dangerous as the model says if the goalie has had to move first. That is the idea I test here.
Nobody records the pass
The NHL's public play-by-play records shots, hits, faceoffs, giveaways and takeaways. It does not record passes. So every public shot model, mine included, is blind to the thing coaches talk about most on a power play: moving the puck to move the goalie.
A one-timer off a pass through the seam and a wrist shot from a player standing still at the same spot look identical in the data. They get the same expected goals. Anyone who has watched a power play knows they are not the same shot.
The fix: the NHL's goal tracking, and the royal road
The NHL does publish tracking data, in one narrow place. For every goal, the replay animation on NHL.com is driven by the real positions of the puck, every skater and both goalies, ten times a second, for the ten or so seconds before the puck goes in. I collected all of them for three seasons: 4,638 power-play goals.
From the puck's path I can find the moment of the shot and the last pass before it. That is enough to measure the most famous kind of pre-shot movement there is.
The royal road is the line down the middle of the ice, from one net to the other. A pass that crosses it just before the shot forces the goalie to push across his crease. If the shot arrives before he is set, he is beaten by the pass, not the shot.
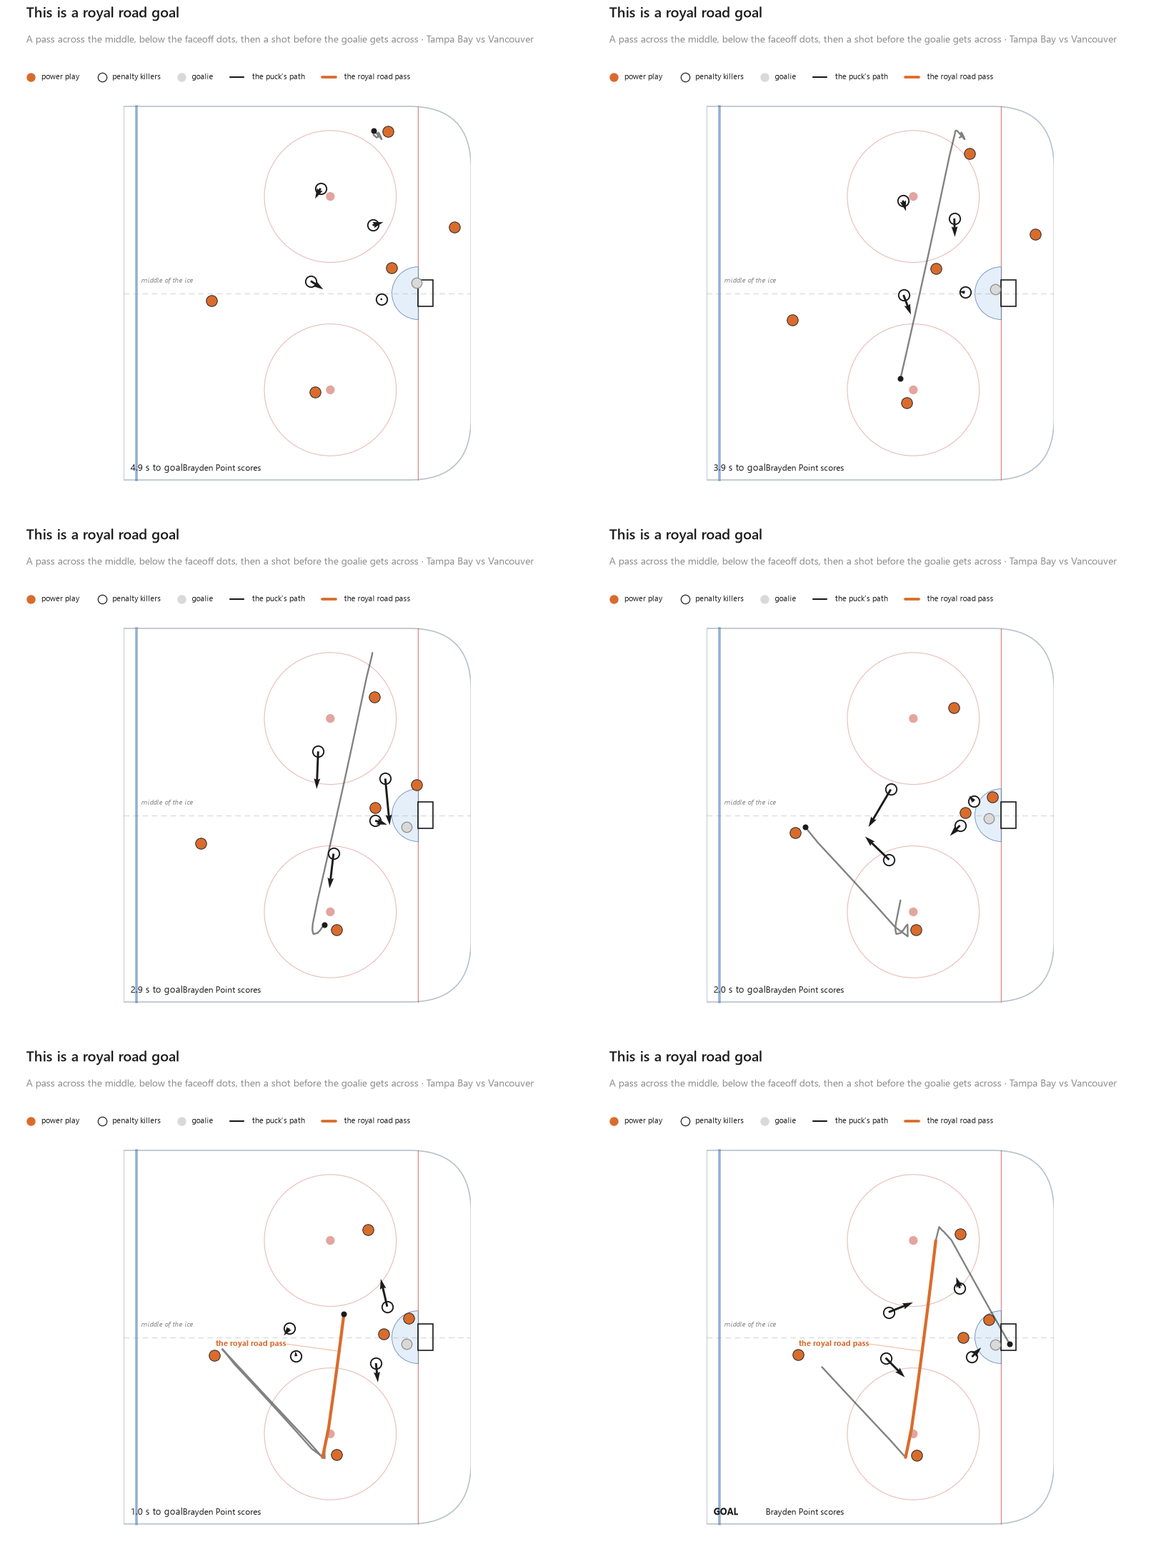
My definition is simple. A royal road goal is a goal where a pass crossed the middle of the ice, down low below the faceoff dots, in the three seconds before the shot. The puck has to be moving at passing speed when it crosses; a puck carried or nudged across in a net-front scramble does not count. Tips count: a cross-ice feed that gets redirected in still beat the goalie with the pass. [4] Over three seasons, 518 of 3,634 tracked power-play goals fit, about one in seven.
Think back fondly to the last time the Flyers had an enjoyable and legitimately good power play, with Claude Giroux distributing from his office along the half-boards. That power play could score any number of ways, yet that cross-seam pass to Voracek was money.
I miss that.
Teams that can make this pass have good power plays
Some power plays score this way all the time. Edmonton has 28 royal road goals in three seasons, about one every nine games. Dallas has 25. Tampa Bay has 24.
| Team | Royal road goals, 3 seasons | Per 60 minutes of power-play time | Overall power-play rank (goals per 60, of 33) |
|---|---|---|---|
| Edmonton | 28 | 1.42 | 1st |
| Utah | 18 | 1.29 | 18th |
| Dallas | 25 | 1.14 | 2nd |
| Arizona (2023-24) | 8 | 1.10 | 7th |
| Tampa Bay | 24 | 1.09 | 4th |
| League median | 0.75 |
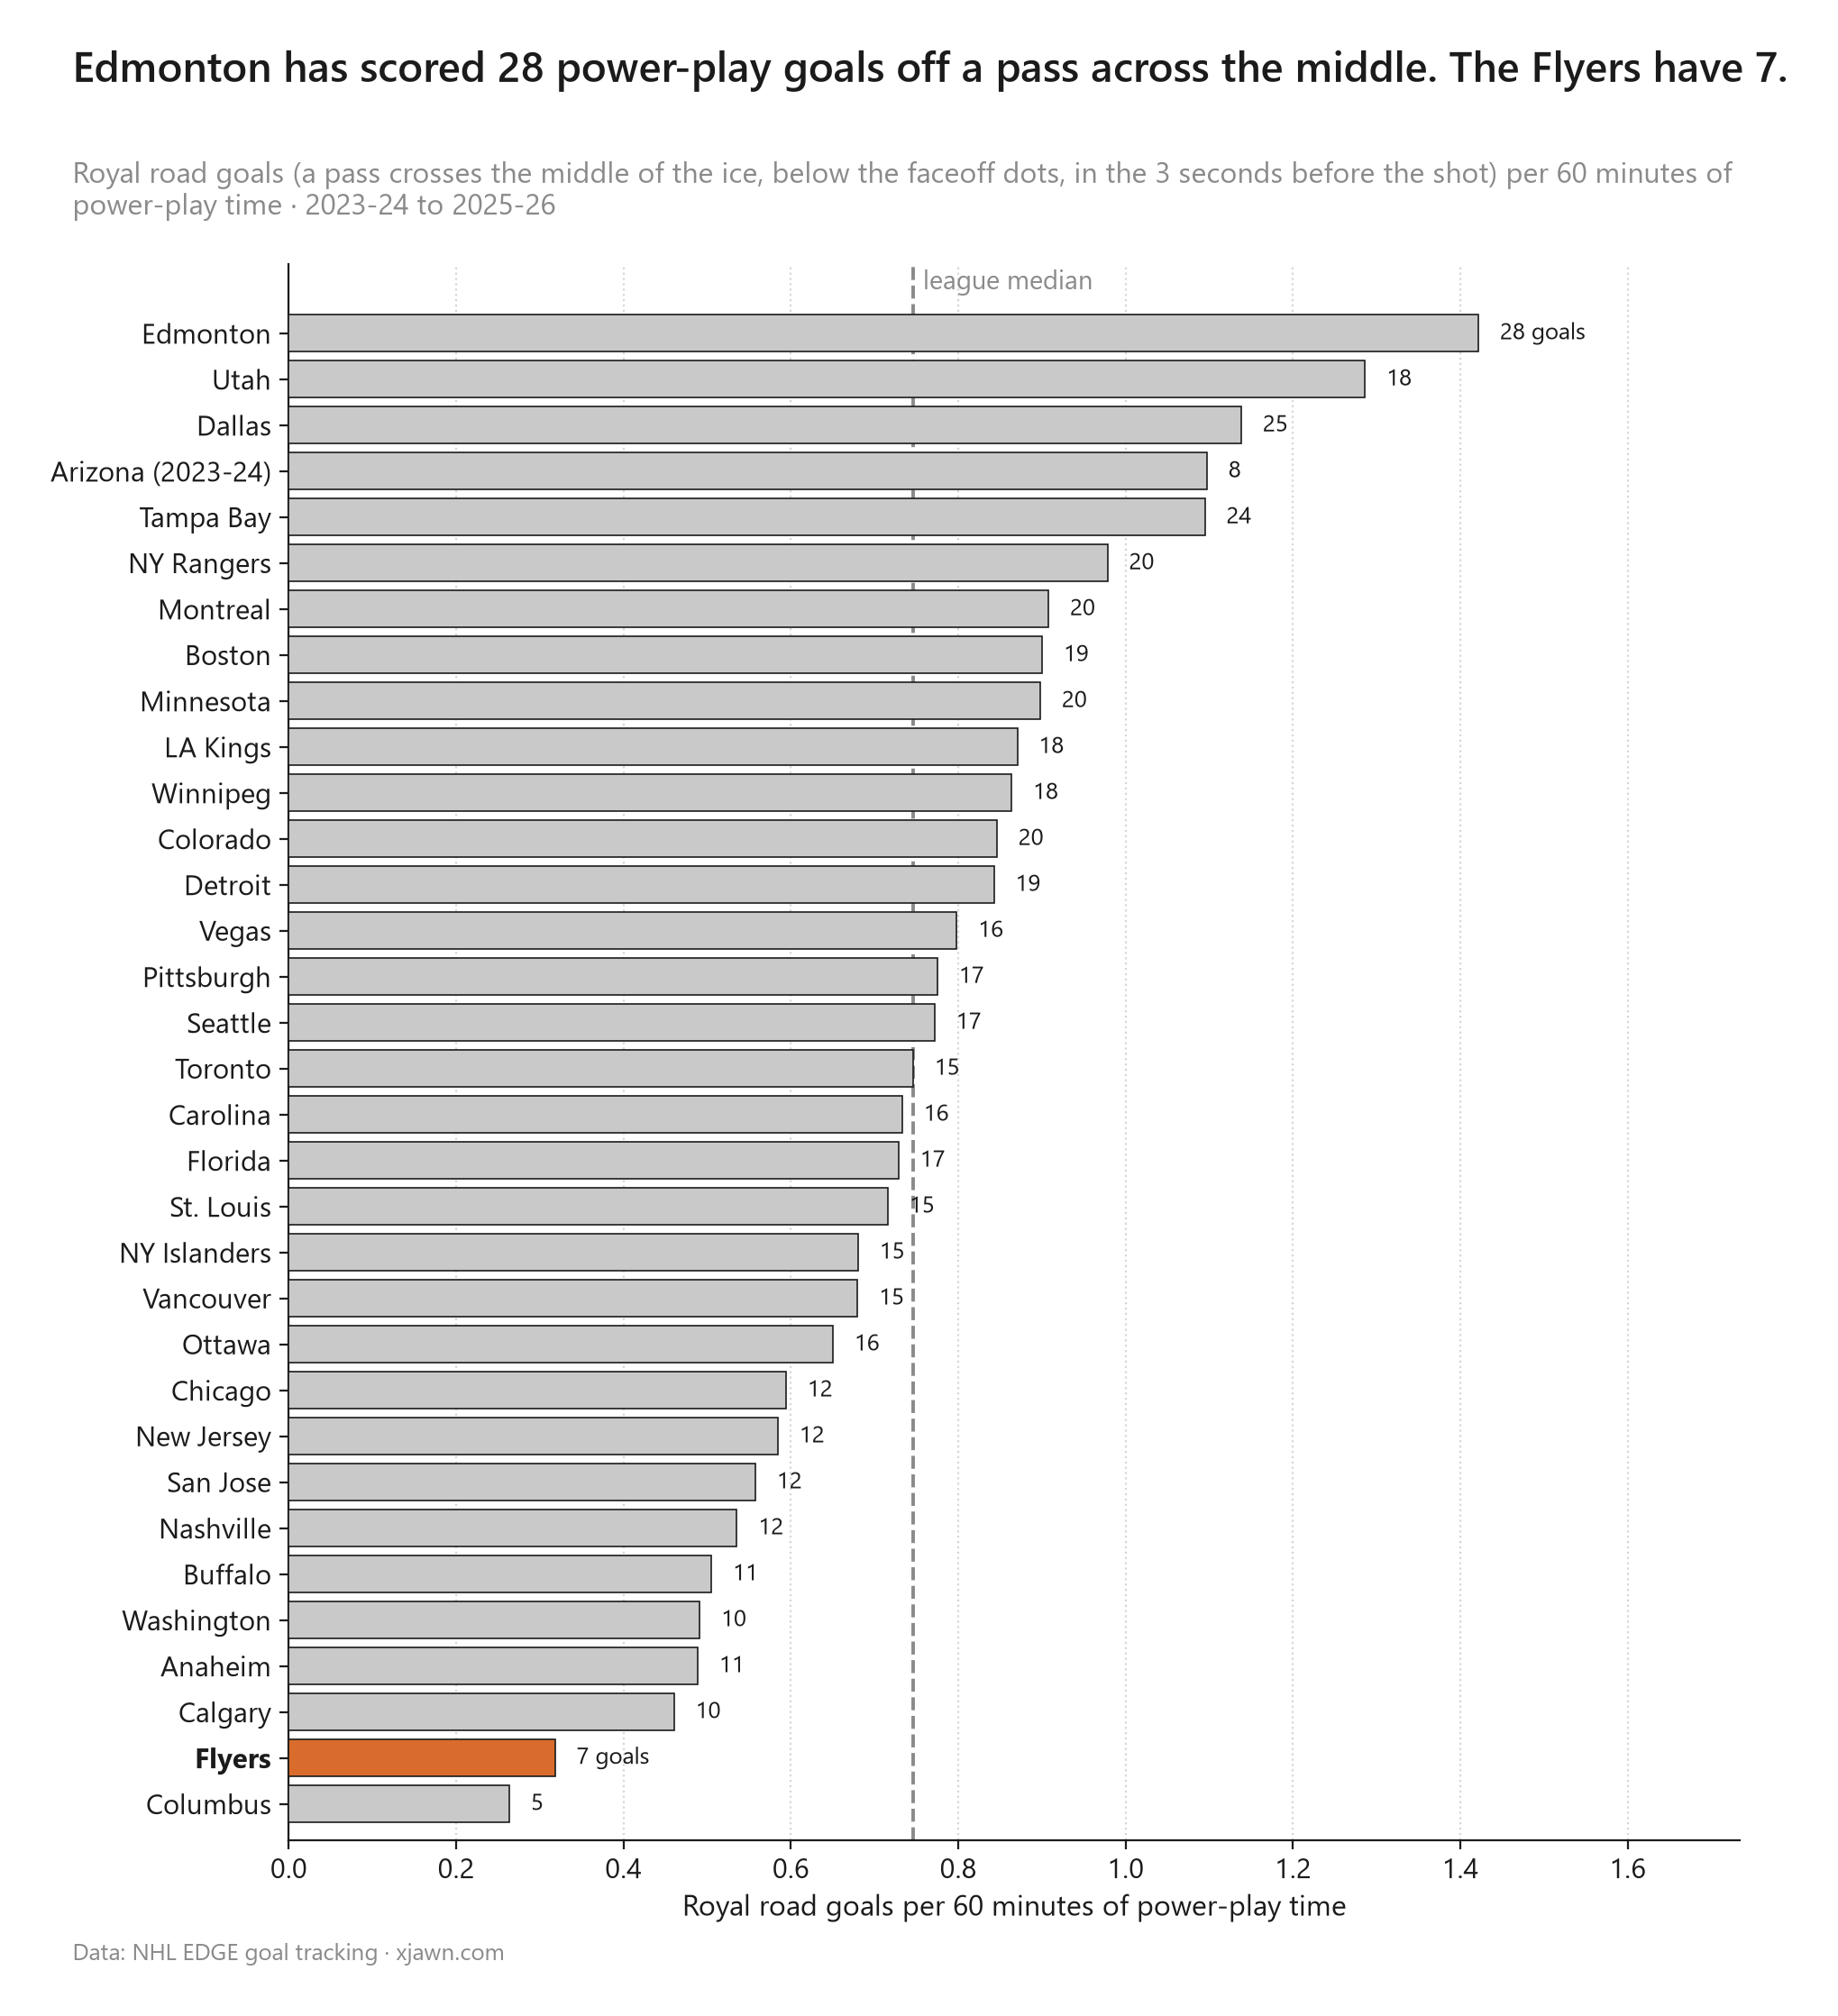
Unsurprisingly, those are good power plays. Edmonton's is the best in the league over these three seasons. Dallas is second. Tampa Bay is fourth. Four of the top five here are top-ten power plays. Utah is the exception: it scores this way more than almost anyone and is still mid-table, because it scores little any other way.
Some of that is trivial. A royal road power-play goal is a power-play goal. Score more of them and you have scored more goals. So of course the teams at the top of this list have good power-play numbers.
So take the royal road goals out, and look at everything else. Rebounds, point shots, net-front tips, shots off the rush: every power-play goal that did not come off a pass across the middle. If the royal road were just one more way to score, a team's royal road goals would tell you nothing about the rest.
They do tell you something. Split the league into thirds by how often teams score off the royal road:
| Teams, by royal road scoring | Royal road goals per 60 | All other power-play goals per 60 |
|---|---|---|
| Top third (Edmonton, Dallas, Tampa Bay...) | 1.03 | 4.76 |
| Middle third | 0.76 | 4.64 |
| Bottom third | 0.50 | 4.18 |
The teams that score the most royal road goals also score the most of everything else, about four extra goals a season. Across all 33 teams the rank correlation is +0.44, and it holds up with Edmonton taken out (+0.38). [5]
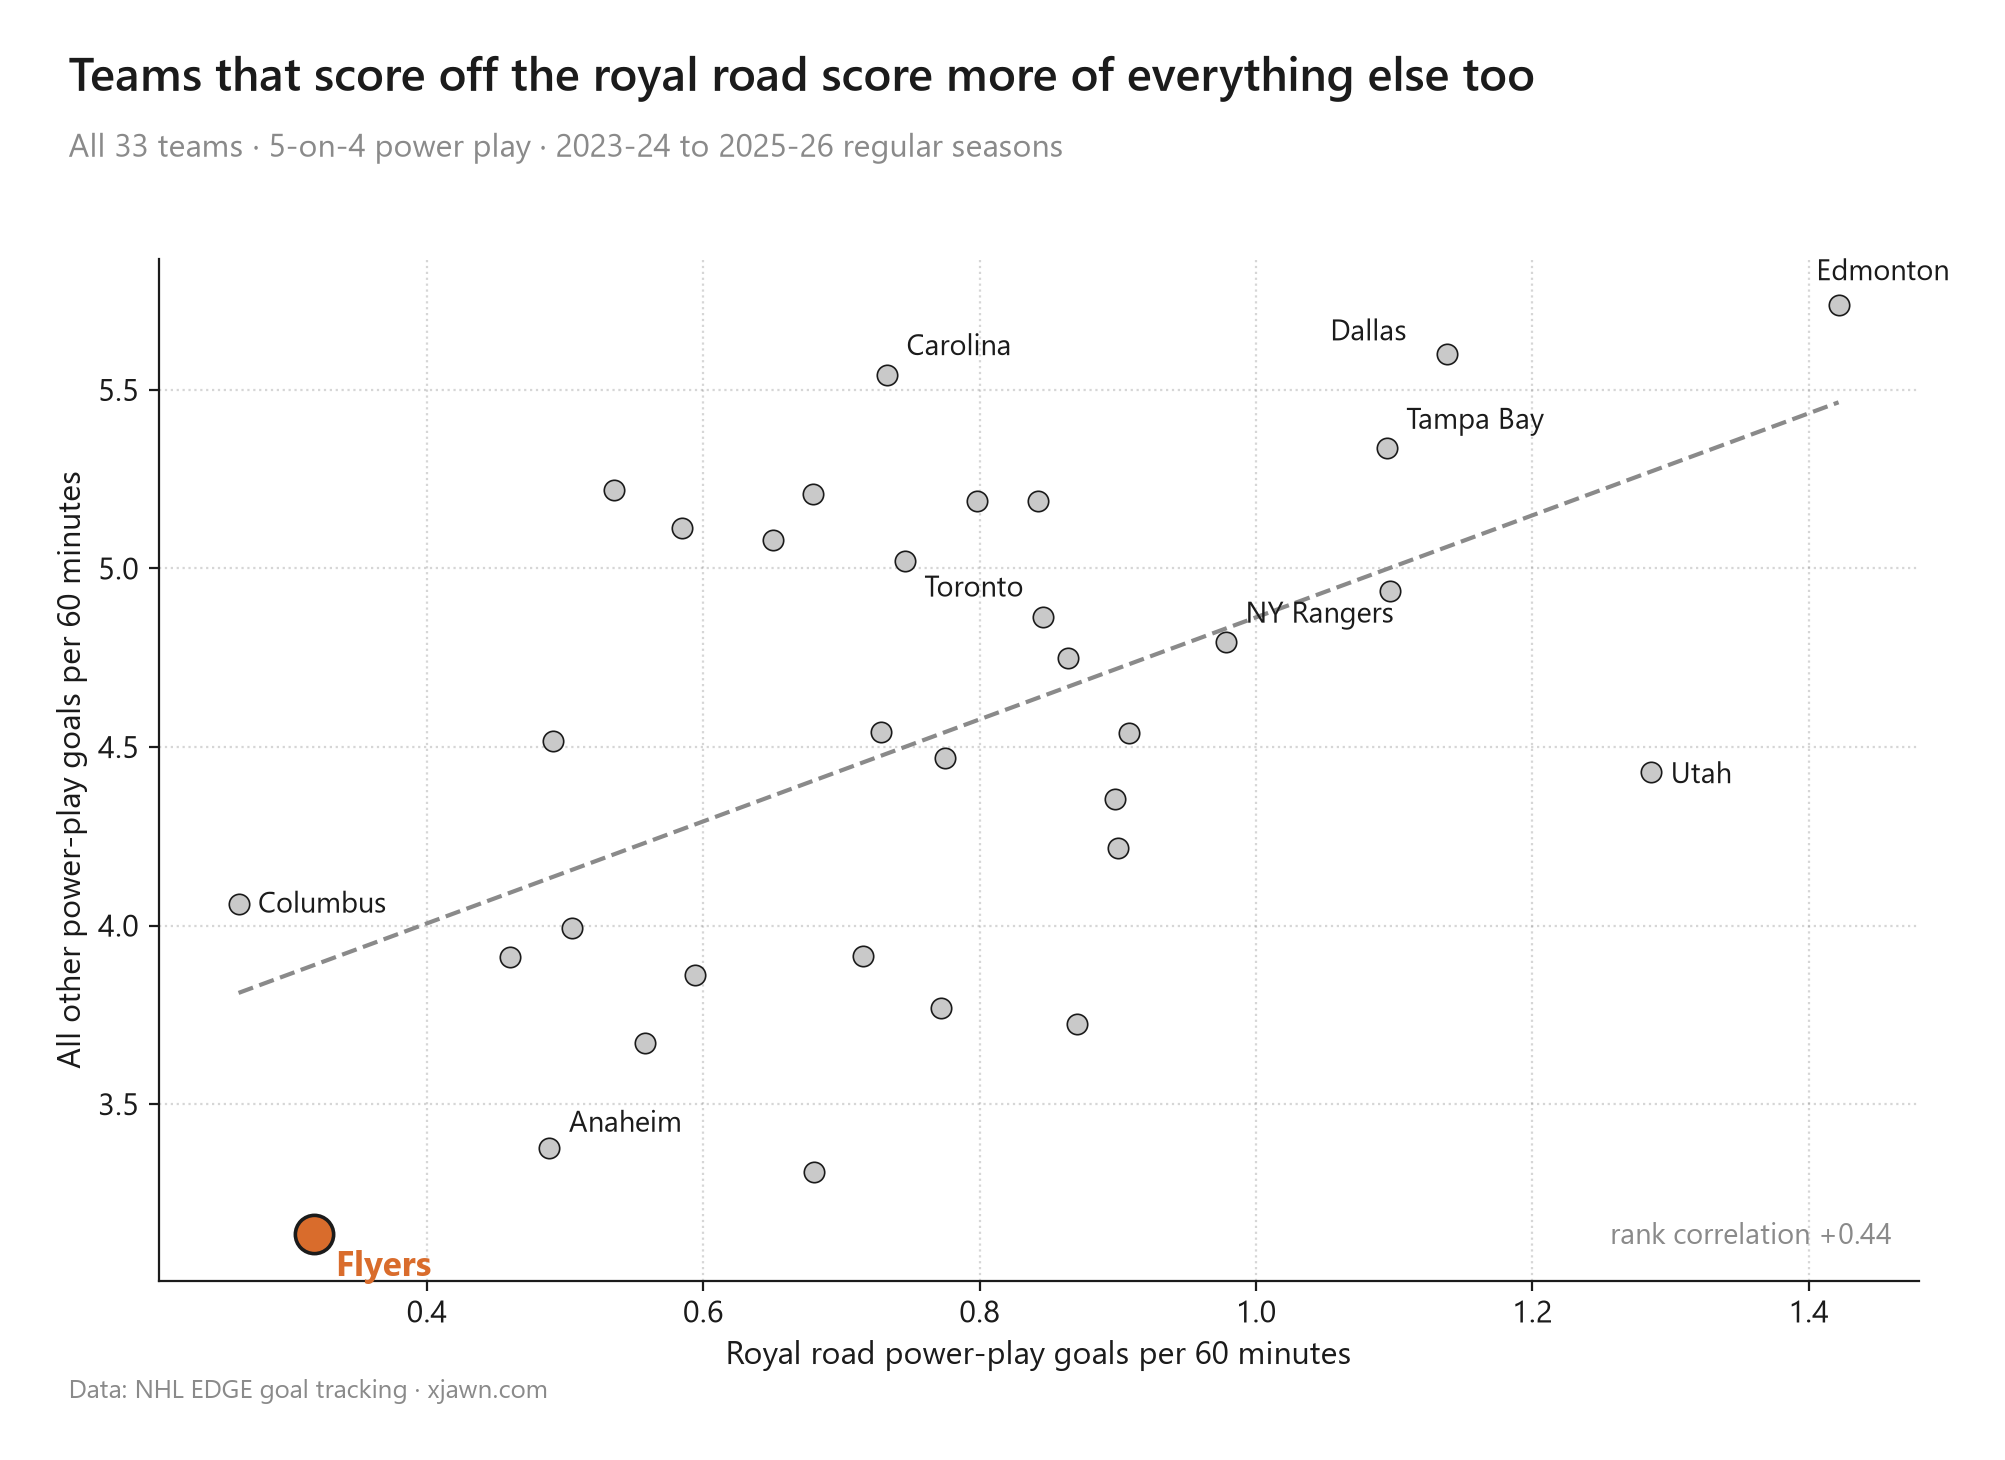
The conclusion: teams that can execute the royal road pass have good power plays. It is not just that the pass produces its own goals. A unit that can move the puck through the middle of a penalty kill is a unit that can do the other things too. And a penalty kill that has to respect that pass cannot sit on everything else.
The pass also matters shot by shot: at the same expected goals, a shot that follows a long sideways pass goes in more often than one that does not. The shot model is missing something real, and this is it. [1]
The Flyers almost never score this way
Seven. In three seasons and 1,320 minutes of power-play time, the Flyers have scored seven royal road goals. Edmonton has 28. Dallas has 25.
They can do it. Here are two of the seven.
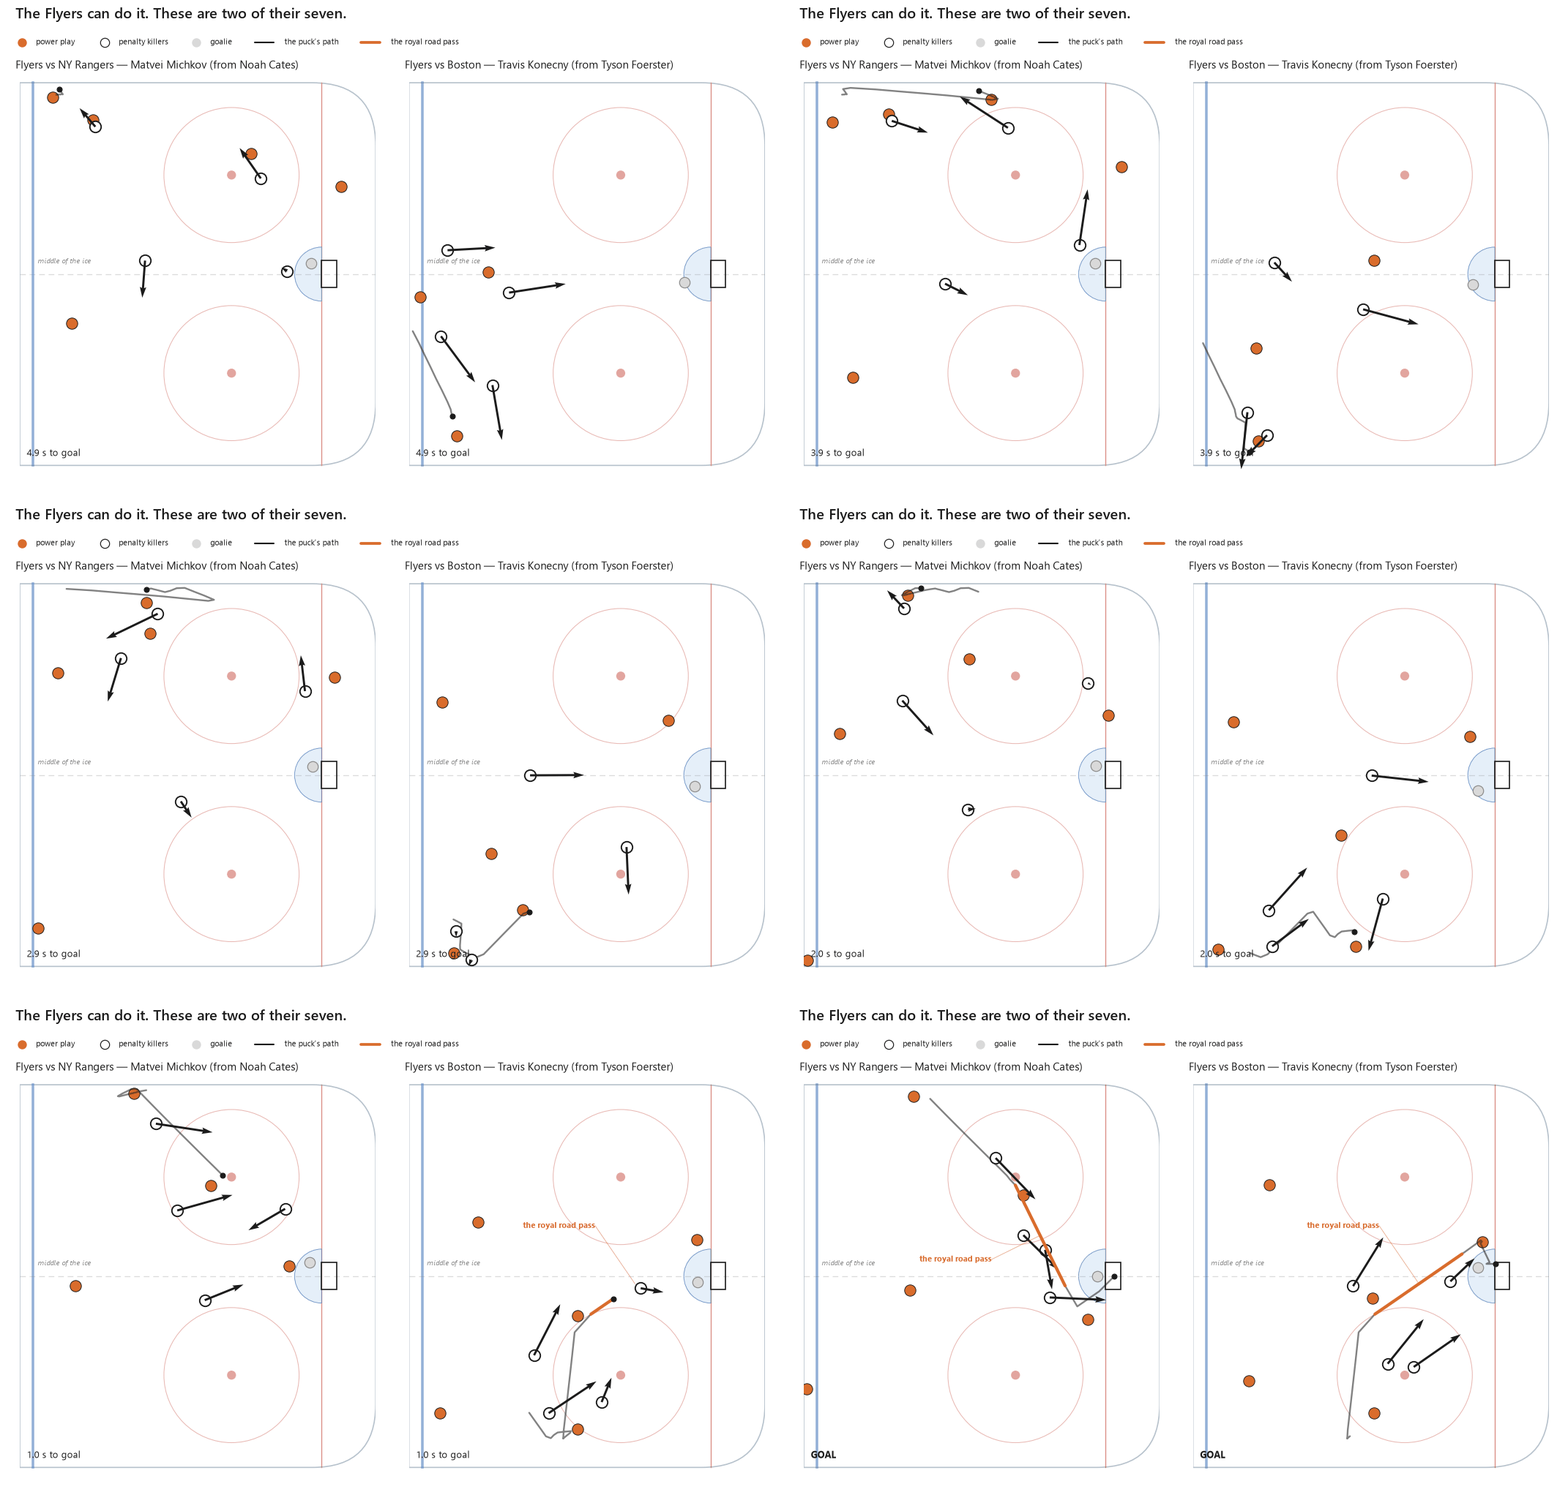
Look at how short those passes are. Michkov's came off a 22-foot feed and Konecny's off a 13-foot one, and those two are the clearest of the seven. None of the seven goes from one faceoff dot to the other. The Tampa Bay pass in the definition above travelled 49 feet. Even when the Flyers get through the middle, it is a quick play in tight, not the long seam pass that makes a goalie cross his whole crease.
That is 0.32 per 60 minutes, second-lowest of 33 teams. Only Columbus is lower. The league median is 0.75, and it sits above the top of the Flyers' error bar (0.13 to 0.66), so this is not just a small sample being unkind. [6]
That is the rate, and a team that scores little of everything will have a low rate of anything. So look at the share too. Royal road goals are 9% of their power-play goals, against 14% for the league, also second-lowest. The Flyers are low on both counts: they score few goals, and an unusually small slice of those few come off the royal road. And it is not that they create fewer chances: per 100 expected goals they have 5.8 royal road goals, against a league median of 11.6. Still second-lowest.
In goals: if the Flyers scored off the royal road at a median rate they would have about 9 more goals over three seasons. Royal road goals are about a seventh of the league's power-play scoring and about a quarter of what the Flyers are missing against an average power play.
So what do Flyers power-play goals look like? Mostly a short play on one side of the ice, a point shot through traffic, or a scramble. Here are three real ones: off the rush, net-front traffic, and a greasy jam play. Watch the dark line. It is the puck, and there is no pass across the middle in any of them.
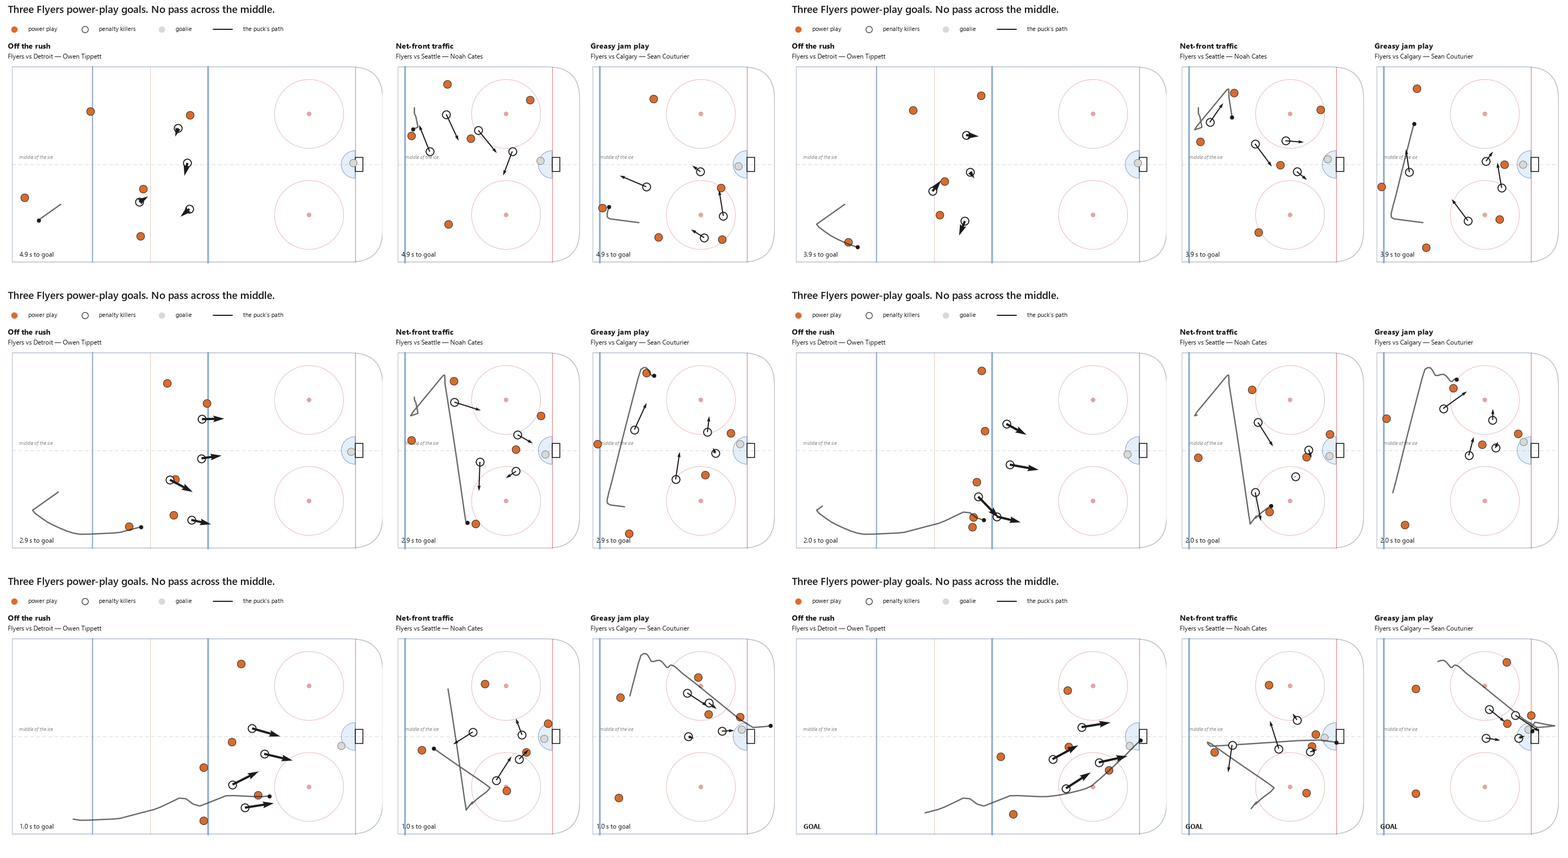
Go back to where and when the missing goals are: everywhere on the ice, on first shots, late in the power play. That is what a power play looks like when it cannot make the goalie move.
What to watch this season
Zegras may not be G, but he is a damn good passer. I think the skill is there now, and we again have the personnel pull off this type of play. I just hope they look for it.
What this cannot say
- I only have tracking data for goals. The tracking exists for goals and nothing else. I can count the royal road goals the Flyers scored. I cannot count the royal road passes they tried and missed (unless they just so happen to be embedded in these clips prior to when the goal is scored), or never tried. So I cannot tell you whether they attempt this play less or execute it worse.
- Seven is a small number. By season it is 2, 2 and 3. Only the three-year total carries weight. The rate is clearly below the league. The share (9% against 14%) on its own is a lean, about a 1-in-7 result if the Flyers were really average.
- This is about how often, not how much a team relies on it. Everything above counts royal road goals per minute of power-play time. The percent of a team's goals that come this way is a different number, and it does not track power-play quality: Carolina (12%) and Toronto (13%) have strong power plays that rarely score this way, and Utah (22%) and Los Angeles (19%) do it a lot with ordinary results. Being able to make the pass goes with a good power play. Leaning on it does not.
- The league relationship is modest. +0.44 across 33 teams over three seasons. Season by season it is weaker (+0.16) and not clearly different from zero.
- Shooting talent is still part of the story. The Flyers' shooters rate below the league median. But across the league a unit's shooting talent predicts only a small part of how it finishes, and for the Flyers it predicts well under a tenth of the gap. Young shooters like Foerster and Michkov also have short track records, so their ratings are cautious. That question deserves its own article.
- The definition is mine: the puck crosses the middle in the last three seconds. A tighter two-second window and a stricter "the last pass itself crosses" rule both leave the Flyers in the bottom three.
- The tracking could make the shot model better, but not yet. With goals and the non-goals recovered from the same clips, I can measure how much the model misses. At the same expected goals, a shot after a longer sideways pass scores more often, and so does a shot taken while the goalie is still off his angle: each adds about a quarter to the odds per step (+0.25 and +0.22 in log-odds per standard deviation). Knowing how far the goalie had to move before the shot would be a real feature. The catch is that this tracking exists only for goals, so it cannot be a feature on every shot. A stand-in built from play-by-play alone recovers a sliver of it (+0.06 per standard deviation across 57,000 power-play shots), which is enough to prove the effect is real and not enough to use.
Notes
- The tracking clips run for about ten seconds before each goal, so they also contain 1,361 power-play shots that did not go in. That lets me compare goals with non-goals that the shot model rated the same. The further the last pass travelled sideways, the more likely the shot was to score, beyond what the model expected (+0.25 in log-odds per standard deviation, interval 0.14 to 0.35, and it holds with rebound set-ups removed). A goalie caught off his angle shows the same thing (+0.22). The strict version of the test, "did the puck cross the exact middle of the ice", points the same way but is weaker shot by shot (+0.08, which could be chance; +0.14 with rebound set-ups removed). I do not show a chart of this because every shot in the sample comes from a sequence that scored a few seconds later, so the raw scoring rates are very high and only the gap between the two groups means anything. ↩
- The luck check. I took each of the 1,824 shot attempts and let it score at exactly the chance the model gave it, then replayed the three seasons 5,000 times. Only one or two replays came out as bad as what really happened. By season, 2023-24 and 2025-26 each fall outside what luck produces on their own; 2024-25 does not. It is also not the model being wrong about power plays in general: league-wide, 5-on-4 goals come to 99% of expected goals, and between 95% and 105% in every area of the ice. ↩
- Shooting talent. I rated each team's five most-used power-play skaters by their finishing record from before each season, so a player's power-play shooting that year cannot count toward his own rating. Across the league that rating explains about 9% of how units finish. For the Flyers it predicts a shortfall of 0.08 goals per 60. The real shortfall is 1.61. And the same players finish differently depending on the situation. Per shot, at 5-on-5 against on the power play: Tippett +0.009 and -0.028, Konecny +0.012 and -0.022, Foerster +0.017 and -0.032, Cates +0.002 and -0.046. ↩
- How a royal road goal is found. The shot is located from the puck's own path: the spot play-by-play gives for the shot, and the moment the puck suddenly accelerates toward the net. That works on 89% to 97% of every team's power-play goals, so team counts are comparable. A goal counts if a pass crossed the centre line of the ice, side to side, in the three seconds before that moment, with the puck moving at passing speed as it crossed (30 feet per second or more, so a puck carried or nudged across does not count), and did it below the faceoff dots (within about 20 feet of the goal line). A pass from point to point up high does not count; it does not make the goalie move the same way. I checked two stricter versions, a two-second window and "the last pass itself must cross". The rankings barely move and the Flyers stay in the bottom three. ↩
- The +0.44. This is a rank correlation across 33 teams (Arizona's last season and Utah count separately), between royal road goals per 60 and every other tracked power-play goal per 60. Its interval is wide, 0.08 to 0.68, because 33 teams is not many. Season by season it is weaker (+0.16) and could be zero. I lean on the three-year version because one season of one team is about five royal road goals. ↩
- The Flyers' error bar. Seven goals in 1,320 minutes. If their true rate were the league median they would expect about 16. The exact interval for seven events runs from 0.13 to 0.66 per 60; the league median is 0.75. ↩